The latest OPEC Monthly Oil Market Report is out with OPEC crude only production numbers for May, 2016. I have compared these numbers with those published by the EIA in their Short-Term Energy Outlook table 3a. All data is in thousand barrels per day and the last data point in May 2016 except for the projection in the one chart below.
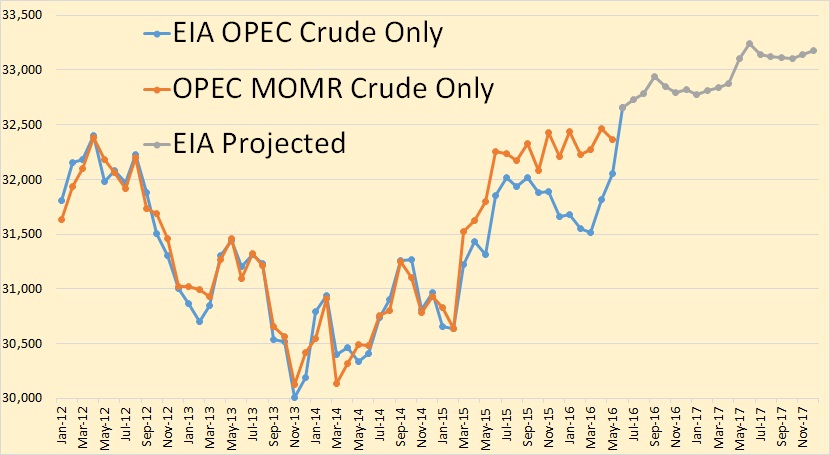
The EIA has OPEC crude production up 238,000 bpd in May to 32,052,000 bpd while OPEC’s “secondary sources” has OPEC production down 100,000 bpd to 32,31,000 bpd in May. The MOMR still has their May production 309,000 bpd more than the EIA.
However that all changes next month, according to the EIA. They have OPEC crude production jumping by 600,000 bpd in June to 32,652,000 bpd. They did not project individual countries however so we have no idea where they believe all that oil is going to come from. Frankly, I just don’t believe it is going to happen.
Read More