EIA’s Electric Power Monthly – May Edition with data for March

This is a guest post by islandboy.

Any comments not related to petroleum (politics, renewable energy, or coal for example) should be in this thread, there will be a separate Open thread for Petroleum (oil and natural gas) discussion.

chart/

chart/

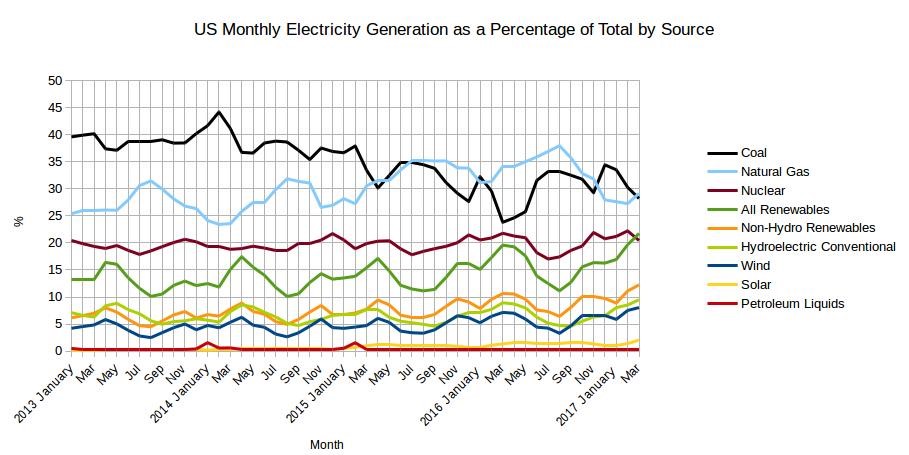
The EIA released the latest edition of their Electric Power Monthly on May 25th, with data for March 2017. March data includes some milestones which are significant in that these circumstances have not existed for a very long time, if ever. Read More

Texas Update, May 2017

chart/

The Chart above compares several different combinations of past (vintage) data to estimate output. The dotted line is based on the most recent 8 months (August 2016 to March 2017) of data saved from the RRC website, the blue solid line is based on the past 12 months of data, and the yellow line is based on the most recent 3 months of data. Read More

Oil Price Volatility and US EIA Data

A number of news media pieces have recently suggested that oil prices may fall due to soaring output in the US.  Output from US light tight oil (LTO) may not rise as quickly as some EIA reports may suggest. One source of confusion is that the EIA creates many reports and some are more reliable than others. The two charts below cover US LTO and US crude plus condensate (C+C) output.

US LTO Output from the EIA Drilling Productivity Report (DPR) and EIA Tight Oil (LTO) estimates in kb/d.

chart/

US EIA monthly C+C output and centered 4 week average output in kb/d.

chart/

Read More

Texas and Eagle Ford Update April 2017

Dean Fantazzini recently updated his estimates for Texas Oil and Natural gas. Data from the Texas Railroad Commission has improved so correction factors are smaller, the estimates from Dean now match the estimates by the US EIA fairly closely for Crude plus condensate (C+C) produced in Texas.
There was a noticeable change in the Texas data about 6 months ago so I show an estimate based on the correction factors from the previous 6 months. Dean prefers to show an estimate based on all the data (which he has done for many months) and an estimate based on the most recent 3 months of data (which has been presented more recently). The EIA estimate is more consistent with the 3 month or 6 month estimate with the “all vintage data” estimate being somewhat higher.

chart/ Read More