Texas Update- November 2017

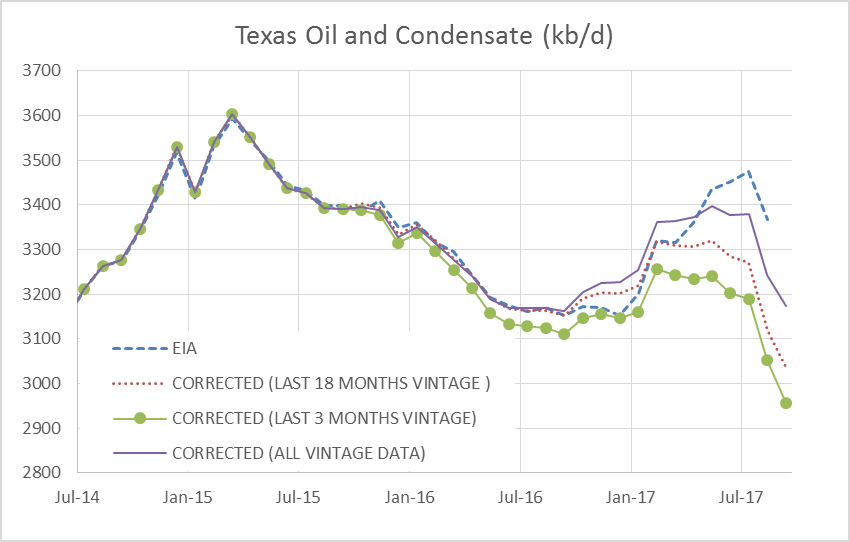
Dean Fantazzini has provided his latest estimates of Texas oil and natural gas output.

His analysis is based on RRC data only. Each RRC data set from Jan 2014 to Sept 2017 for crude and from April 2014 to Sept 2017 for condensate and natural gas are used in the “all data” estimate, the most recent 49 months of data are collected for each individual data set. After March 2016 there was a shift in the data for crude and condensate so for the C+C estimate, I include an estimate which uses all data from April 2016 to the most recent data point (“Corrected 18 month vintage”). Dean prefers to present an “all vintage data” estimate and an estimate using only the most recent 3 months “correction factors”. For Sept 2017 the all vintage data estimate is 3174 kb/d, the last 3 month vintage estimate is 2957 kb/d, and the last 18 month vintage estimate is 3039 kb/d with falls of 68, 96, and 80 kb/d respectively from the previous month.

chart/

Read More

GoM July Production Update

A Guest Post by George Kaplan

GoM C&C production for July by BOEM was 1746 kbpd and by EIA 1761, compared with, respectively, 1631 and 1634 kbpd (corrected) in June. The EIA number is a new peak, the BOEM one is still 24 kbpd short of their March numbers. The growth was from Thunder Horse (partially), Constitution and Baldpate/Salsa (which is mostly gas) coming back on-line, plus continued ramp-up in Stones and Marmalard.

chart/

C&C Production Details

Read More

GoM June Production Update

A Guest Post by George Kaplan

Production

Production for June by BOEM was 1631 kbpd and by EIA 1636, compared with 1673 and 1659 kbpd, respectively, in May. The decline was mostly from Thunder Horse going offline and Constitution staying offline. Hurricane Cindy didn’t seem to have much of an impact, things will be different for the impact of Harvey on August figures.

Even with the two offline facilities coming back July numbers will struggle to beat those for March, and after that the depletion declines and hurricane disruptions take over. Note that the “others” area includes any assumptions BOEM has made to allow for missing data, which is quite a lot this month.

chart/

Read More

EIA’s Electric Power Monthly – June 2017 Edition with data for April

This is a Guest Post by Islandboy

Non-Petroleum comments should be in this thread.

chart/

chart/

The EIA released the latest edition of their Electric Power Monthly on June 23rd, with data for April 2017. April data extends the milestones reached in March as follows:

  • The contribution from solar reached 2.35%, up from 2%
  • The contribution from All Renewables extended its lead over Nuclear by more than 2%
  • The combined contribution from Wind and Solar reached 11%, up from 10%
  • The contribution from Non-Hydro Renewables exceeded 13%, up from 12.24%

Read More