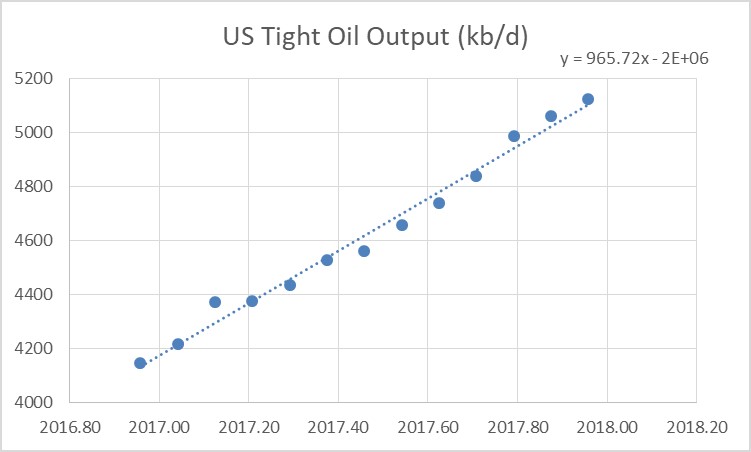
From Dec 2016 to Dec 2017 US Tight oil output has increased by 975 kb/d based on US tight oil output data from the EIA.
For the entire US we only have EIA monthly output estimates through Oct 2017. Over the Dec 2016 to Oct 2017 period US output has increased by 866 kb/d and the OLS trend has a slope of 821 kb/d.
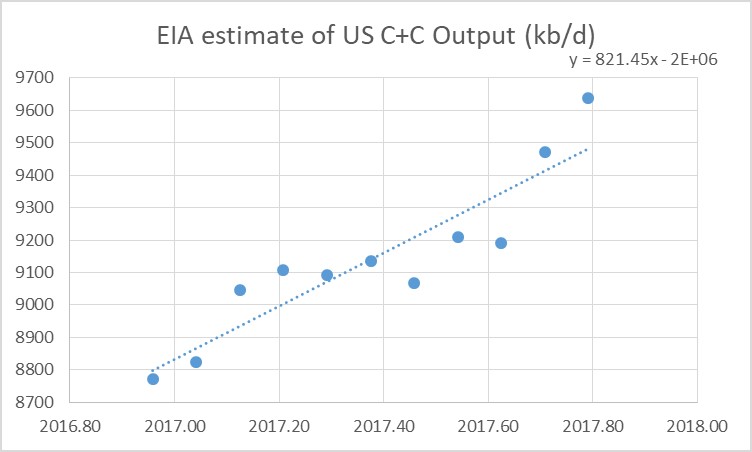
Note that the 866 kb/d increase in US output over 10 months would be a 1040 kb/d increase over a 12 month period.
Most of the increase in US output has been from increased LTO output. The forecasts by several agencies (EIA, IEA, and OPEC) of more than a 1000 kb/d increase in US output in 2018 may assume that the recently increased oil price level will lead to increased investment in the oil sector.
Much of the increase in LTO output has been in the Permian basin and several factors may slow down the recent rapid growth. Among these are limited fracking crews, inadequate pipeline capacity for natural gas, which will limit output as flaring limits are reached, and potential water shortages.
Longer term the various LTO plays will run out of space to drill more wells in the tier one areas (the so-called sweet-spots) and this will limit the rate of increase within 2 or 3 years. It is likely that the Eagle Ford is close to this point, the Bakken might reach that point by 2019, and the Permian basin perhaps by 2021.
For US C+C output, I expect about a 600+/-100 kb/d increase in 2018.