By Ovi
All of the Crude plus Condensate (C + C) production data, oil, for the US state charts comes from the EIAʼs Petroleum Supply monthly PSM which provides updated production information up to March 2025.
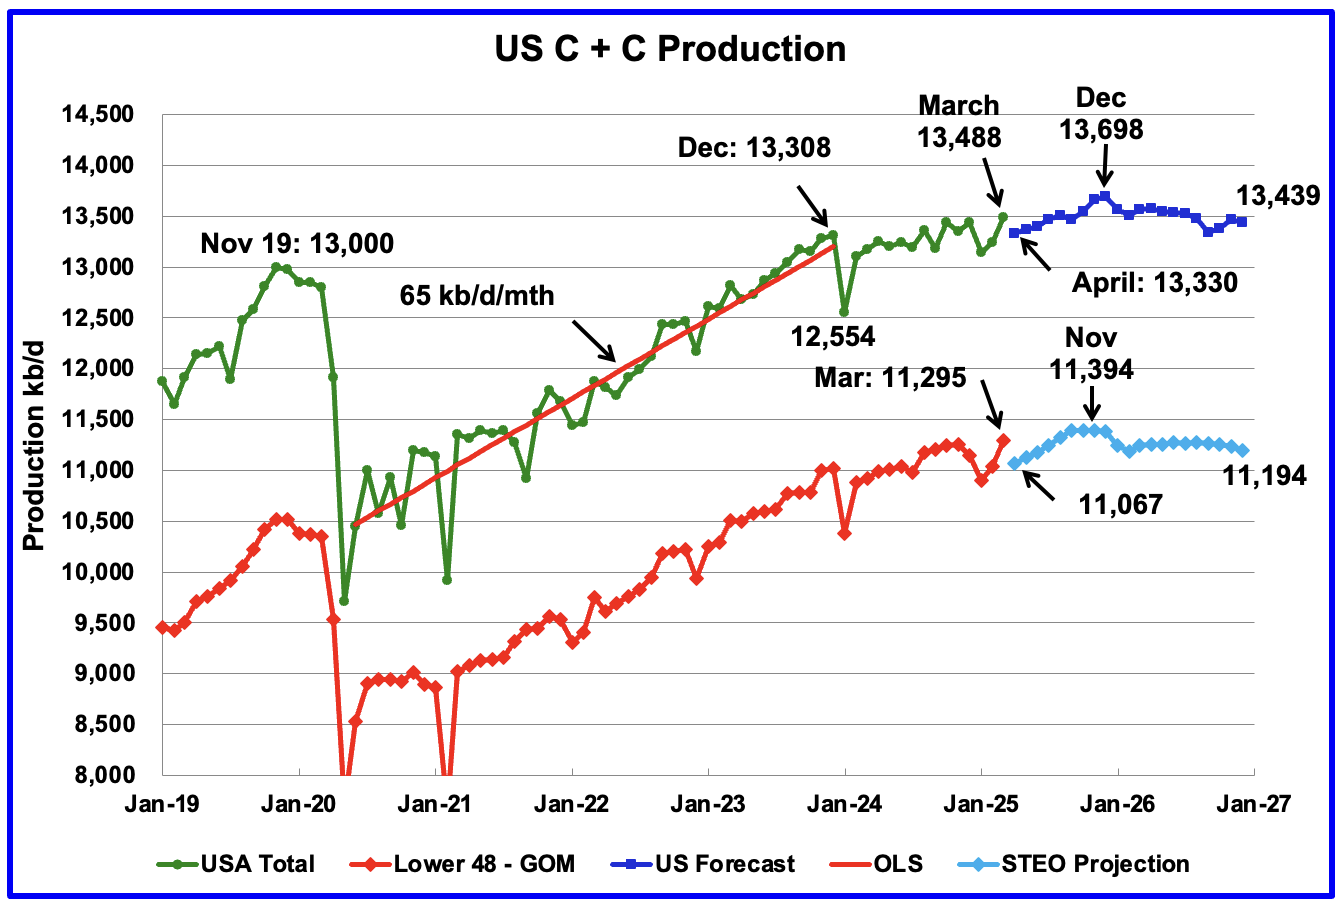
U.S. March oil production increased by 248 kb/d to 13,488 kb/d, a new high. The largest increases came from Texas and New Mexico.
Read More