Texas RRC Crude and Condensate Data, Is Eagle Ford Peaking?

This page Texas Oil and Gas Production was last updated on February 18. However the data on this page has been updated. And the January production has been updated also: Oil and Gas Production Data Query then check “Lease”, “Both”, Statewide and then punch in the appropriate dates. Then when the next page comes up click on “Monthly Totals”. This brings up the updated monthly totals for Crude, Casinghead Gas, Gas Well Gas and Condensate.

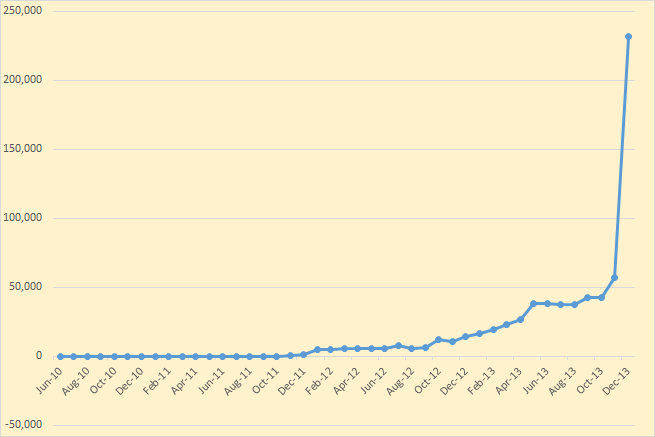
There were revisions going back to July 2010 but only 2013 had any major revisions though there were some 2012 revisions also as the chart below shows.

Texas Revisions

The earlier revisions were smaller and there were some of them that were negative. That is the figures were revised downward.

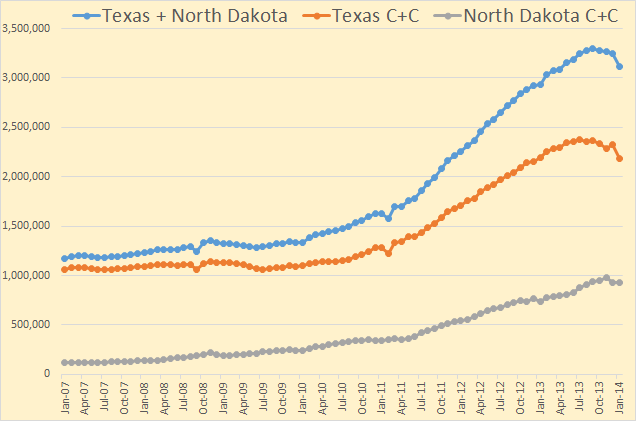
This chart compares Texas with North Dakota. This is all Texas not just Eagle Ford. The last data point for all is January 2014.

Texas + North Dakota

Though there is a lot of conventional production in Texas, the increase is nevertheless about all tight oil. And these two states produce perhaps 95% of all tight oil produced in the United States. And that is about 2  million barrels so far if the Texas RRC is close.

Read More

The EIA’s Drilling Productivity Report, Ghana and China

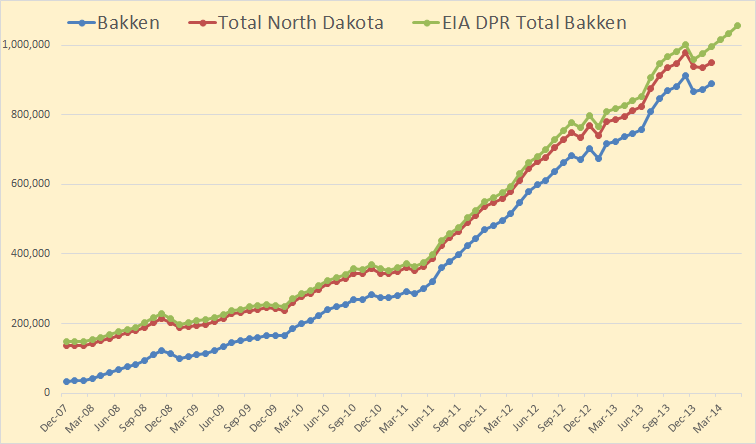
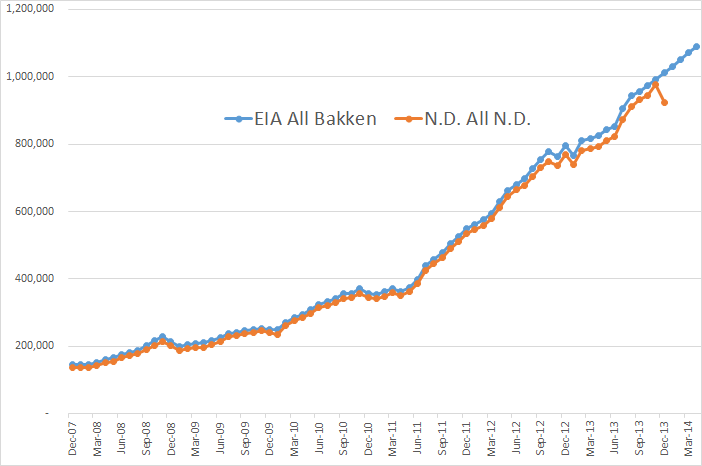
The EIA’s latest Drilling Productivity Report has been published. I found some strange things in the report. For the Bakken, their data does not jive with that posted by North Dakota. I have plotted the two together. The North Dakota includes all North Dakota but not the Montana part of the Bakken. The EIA data includes all the Bakken but not the non-Bakken part of North Dakota. Almost a wash but not quite. Montana produces slightly more than the non-Bakken part of North Dakota, but not very much. Anyway…

EIA New Bakken Report

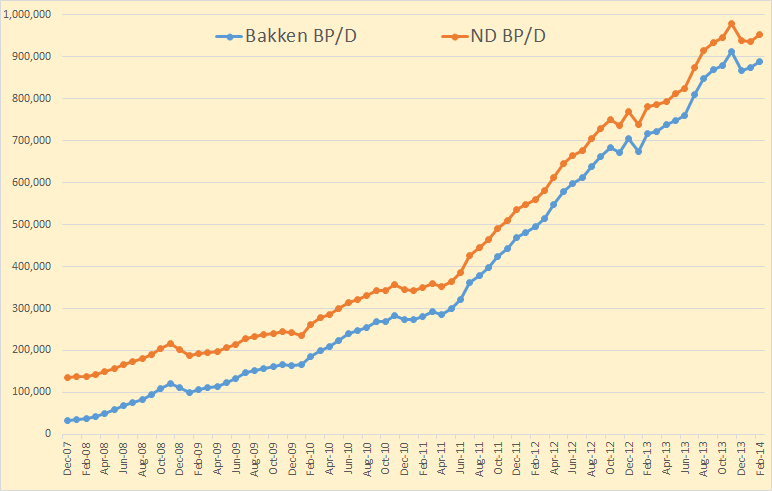
I thought for sure that the EIA would hear that Bakken Production was down about 50,000 barrels per day in December. But Nooooo… they have the Bakken up by over 20,000 barrels per day in December, a difference of 70,000 bp/d. But up until the last two or three months they follow the North Dakota data pretty close so we can hope they update their data in a few months.

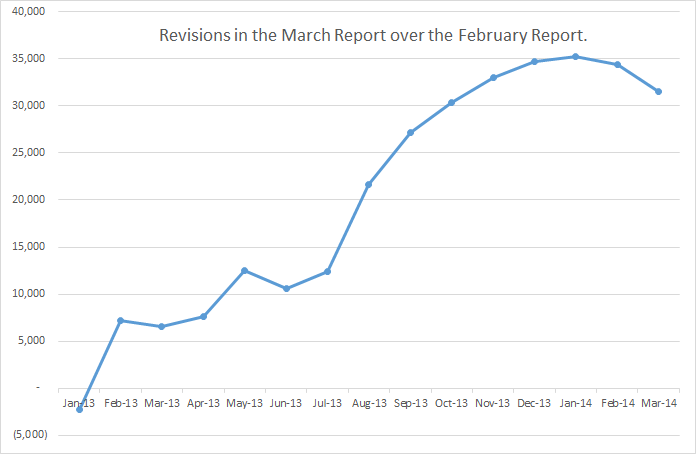
However all LTO production was revised upward in this last report. The chart below is the barrels per day that all tight oil was revised upward.

April Revisions

Doesn’t the strange shape of that chart raise suspicions? December production was revised upward by 34,672 bp/d when it actually should have been revised downward by perhaps twice that amount. January production was revised upward by 35,243 barrels per day. I doubt very much that this was the actual case.

Read More

EIA’s Petroleum Supply Monthly by State, Texas Reporting Problems

The EIA releases two monthly petroleum data sets for US oil production. The Monthly Energy Review which gives the US production and consumption of all forms of energy, oil, natural gas, coal and electricity.  The other, the Petroleum Supply Monthly deals only with petroleum but gives every possible statistic, production, refining, export and import from every state and district.

Concerning total US crude oil production the two should agree but they don’t. From December 2011 back they have the exact same production numbers but the near months differ greatly. I have found that the latter, the Petroleum Supply Monthly is the most accurate. The Monthly Energy Review usually changes their numbers to match the Petroleum Supply Monthly but both revise their numbers as more accurate numbers come in. They both are published the last week of the month but  the M.E.R is always a month ahead with their data.

Here are their the numbers in KB/d and the difference between the two.

Difference 3

Notice that the former had US production up by 333 kb/d in December while the latter had US production down by 77 kb/d in December. But both will be revised to match what each state or pad reports later on.

There is no uniform reporting strategy among different states. They all appear to do it differently and on a different time frame. For instance the PSM, which is the only one of the two that reports state by state production number, reports the exact same numbers for North Dakota that we get from North Dakota. But they get their Texas data from the Texas Rail Road Commission. And the Texas RRC is very delinquent with their reporting. They just report the numbers as they come in from the field and every month they change as more numbers come in, sometimes taking many months until all the numbers are in. So the EIA just guesses at Texas production numbers.

Texas and North Dakota daily C+C production in KB/D. The last data point is December 2013.

Texas + North Dakota

Notice the last nine months are extremely linear. In fact each month, April through December, Texas monthly crude production increased by exactly 50,000 barrels per day.
Read More

The EIA’s Latest Drilling Productivity Report

The EIA’s latest Drilling Productivity Report is out. Not a lot of changes since we now know that the EIA just guesses at the production for the last five months, August through December, then plugs in their estimate for the next two months, January and February. In the case of the Bakken they say December production was 1,003,578 bp/d and January and February will be 1,025,634 and 1,050,521 bp/d respectively. For Eagle Ford December production, they say, was 1,221,576 bp/d and they expect January and February production to be 1,251,617 and 1,285,224 bp/d respectively.

The below chart shows the Bakken production change from month to month. I have shortened the time displayed in order to better show the month to month change.Bakken Change

Notice the dramatic change in the January report for May, June and July. Obviously they looked at the real data and saw how different it was from what they had previously just plugged in, and made the necessary changes. They are saying that the Bakken had a really good December, slightly better than January, then things turn up again in February.

Here is the same chart for Eagle Ford.

Eagle Ford Increase

Not such dramatic changes in the Eagle Ford production data. But notice they are expecting an upturn in January and December. We shall see.

Read More

GOM Production and Other News

Not much happening on the Peak Oil front these days. I checked out the BSEE Gulf of Mexico production. Data is in kb/d with the last data point September 2013.GOM Production

Average production from the GOM has been relatively flat for the last two and one half years at about 1.260 million barrels per day. The arrow marks April 2010, the month of the Deepwater Horizon disaster.

The big deepwater plays continue to decline. I guess they are bringing on other wells in order to keep production flat.

Atl+TH+Tahiti+BF

The above chart is combined liquids production of Atlantis, Thunder Horse, Tahiti and Blind Faith. The last data point is September 2013.

Read More