AEO 2015 Preliminary Report

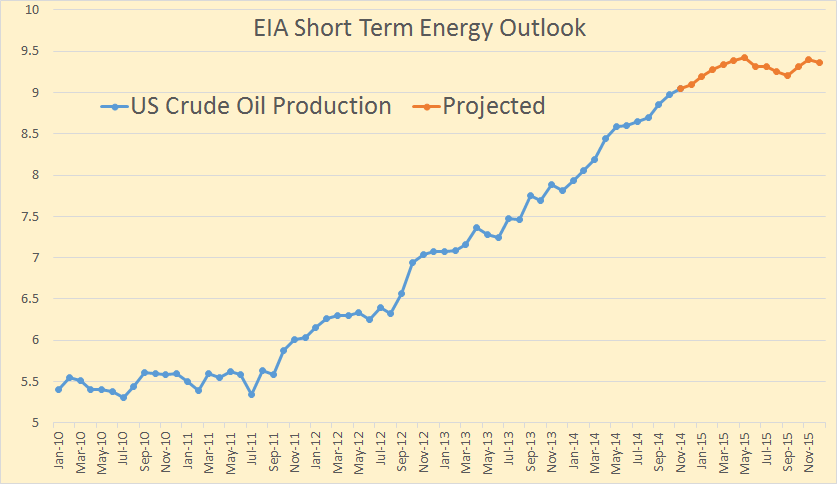
The EIA published, last month, AEO2015 Preliminary Oil & Natural Gas
Production & Price Results
. And just below the title they wrote:

                                    DRAFT – DO NOT CITE
But I am not citing anything, just informing you of what they said. 😉 What they mean however is that they reserve the right to change their mind before the report comes out early net year. And I can certainly understand that. All Oil data is in million barrels per day.

AEO 2015 1

They have lower 48 production hitting a slowly increasing plateau in 2016 and peaking at just under 8.4 million barrels per day in 2027.

AEO 2015 2

They have US Tight Oil production following pretty much the same profile, hitting a plateau in 2016 at about 5.5 million barrels per day and holding flat until starting a very slow decline in 2030.

Read More

Post Carbon Institute’s LTO Reality Check

The Post Carbon Institute has just released a critique of the EIA’s Light Tight Oil projections. It is titled DRILLING DEEPER. The report is highly critical of the EIA’s projections and should be read by everyone interested in Peak Oil.

All data on all charts is in million barrels per day unless otherwise specified.

EIA Oil Projection

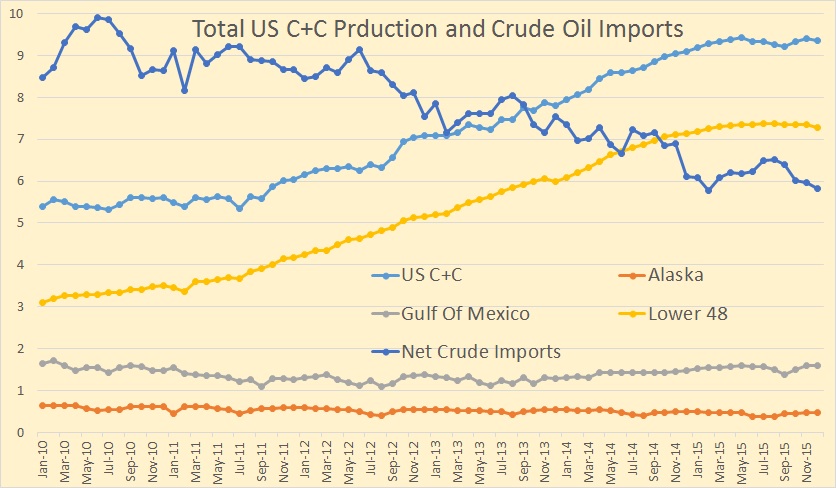
 First a look at the EIA oil projections for US production from all sources. They expect offshore to increase to 2 million barrels per day by 2016, an increase of almost 600,000 bpd from current production. Also note that the EIA has US almost peaking in 2016 and increasing only slightly until the peak in 2019.

EIA LTO Hi Lo Projection

The EIA has several projections, covering all bases. However the reference, or most likely, will be the only one covered in this post.
Read More

Texas RRC Oil and Gas Report, August Data

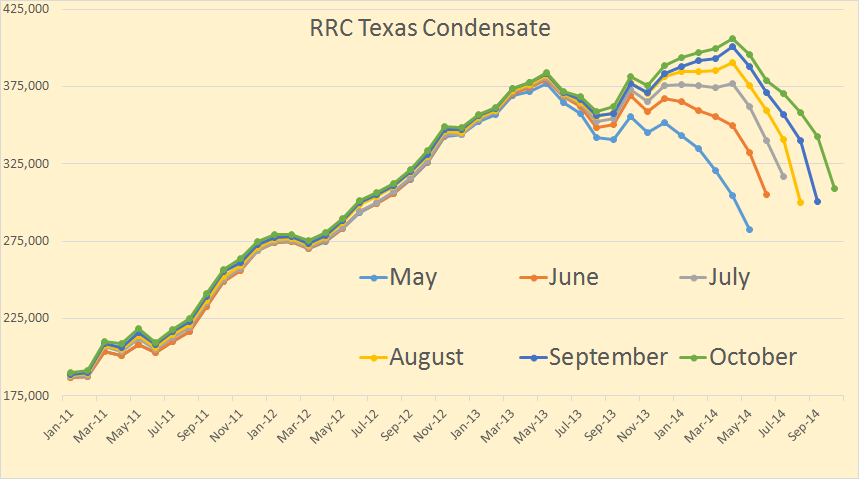
The Texas Rail Road Commission just released their oil and gas production report with the August data. As you probably know by now that this data is incomplete. The latest months will all turn down but as more companies report their data, which can be up to two years late, the data will reflect what is actually produced.

There is something strange about the August data however. This is the first time since last November that all four data sets, Crude, Condensate, Gas Well Gas and Casinghead (Associated) gas, are show lower production than the previous month. So keeping in mind that the previous months data was just as incomplete as this months is, the data should, if production is increasing, still show an increase. This month however, it does not.

All oil data is in barrels per day and all Gas data is in MCF per day with the last data point August 2013.

Texas Crude Only

 The August crude only data was 124,723 bpd below July.

Texas Condensate

Texas Condensate was moving up rather smartly until June of 2013. Since then it has been erratic. It is clear that Texas condensate production is not increasing very much and may now actually be declining. Texas condensate (incomplete data) dropped 41,175 bpd, July to August.

Read More

Texas RRC Data September Report

The Texas RailRoad Comission released their Oil & Gas Production Data with production data through July 2014. The data was actually released Thursday but was all messed up. They corrected their mistake Friday except for condensate. Then yesterday they updated everything. As I have stated before, the RRC data, for the last several months, is incomplete. Nevertheless we can gather some indication of what is happening.

Texas C+C

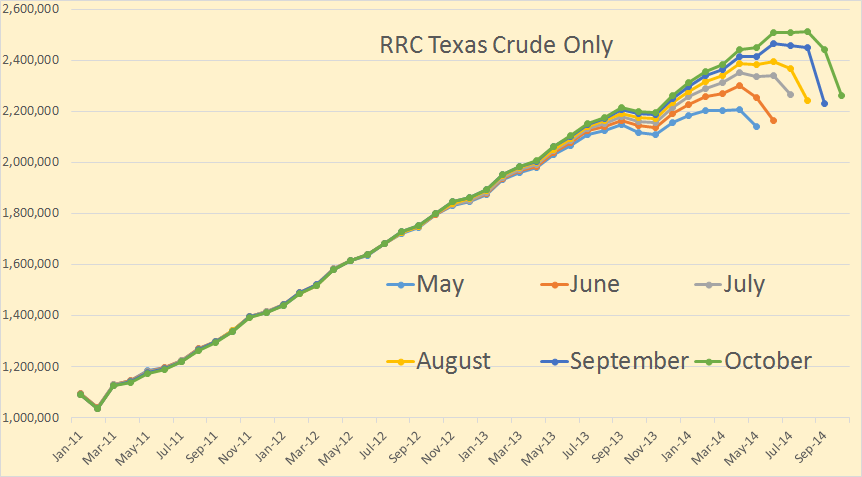
Texas C+C is still increasing at a pretty hefty clip. The EIA data is just an estimate of course but I think it is pretty close to what the data will show when it is all in. I have included six months of data to show how it is increasing month to month.

Texas Crude Only

Texas crude only was down in October and November but has been up every month since. The declines in the last few months is due to incomplete data.

Read More

The EIA’s Drilling Productivity Report

The Eia’s latest Drilling Productivity Report is out. However they have only updated the PDF file. The spreadsheets have not been updated and still have last month’s data. But I will give you what the PDF file shows and perhaps add some charts tomorrow if they get around to updating the Excel spreadsheets.

DPR 1

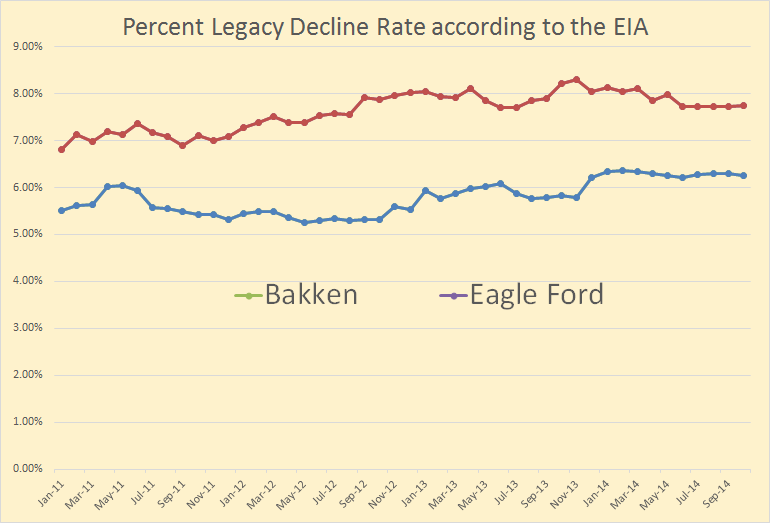
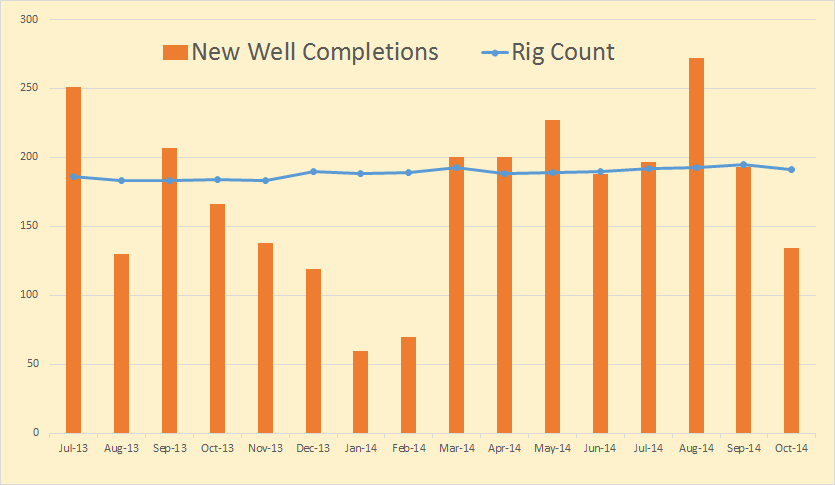
The EIA says Bakken new wells will produce 100,000 bpd in October but all the old wells will decline by 73,000 bpd and leave a net increase of 27,000 bpd. If these numbers are correct and September production was 1,152,000 bpd then that means the monthly decline rate is 6.33%.

DPR 2

The EIA says Eagle Ford new wells will produce 154,000 bpd in October but all the old wells will decline by 123,000 bpd and leave a net increase of 31,000 bpd. If these numbers are correct and September production was 1,551,000 bpd then that means the monthly decline rate is 7.93%.
Read More