What Will 2015 do for Peak Oil?

The Cornucopians are exuberant, they believe that collapsing of oil prices dealt the death knell for peak oil. An oil glut, they say, is what we have, not peak oil. But an oil glut is exactly what we would expect at the very peak. After all, that is what peak oil is, that is the the point in time when the world produces more oil than ever in history… and the most it ever will produce.

I am of the firm conviction that the world is at the peak of world oil production right now, or was at that point three or four months ago. I think history will show that the 12 months of September 2014 through August 2015 will be the one year peak. Whether the calendar year peak is 2014 or 2015 is the only thing still in question, or that is my opinion anyway.

The EIA says, in their Short Term Energy Outlook says US Crude oil will peak, at least temporarily, in May 2015.

STEO 1

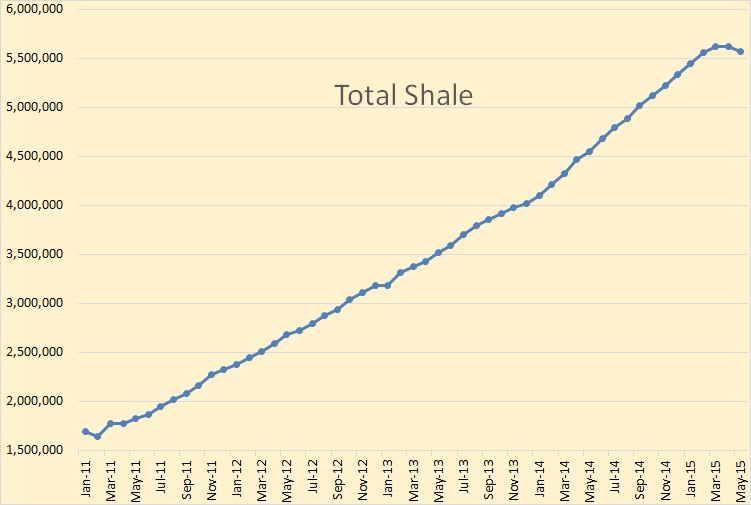
Looking at the area breakdown for total US production:

STEO Total US

This chart includes net US crude oil imports. Notice how they expect crude oil imports to bottom out in February of 2015 at 5.78 mbd then increase to 6.71 mbd in August before declining to 5.82 mbd in December.

Read More

Bakken, Let’s Do The Math

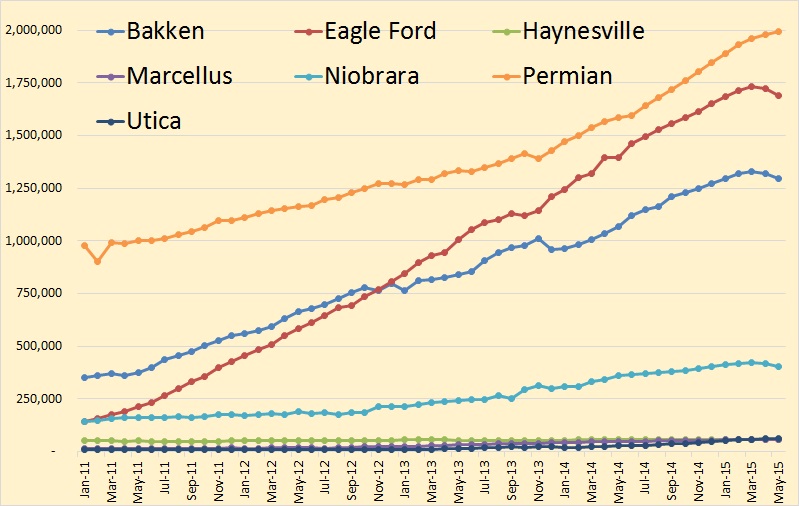
There has been considerable dispute over how many new wells required to keep production flat in the Bakken and Eagle Ford. One college professor posted, over on Seeking Alpha, figures that it would take 114 rigs in the Bakken and 175 in Eagle Ford to keep production flat. He bases his analysis on David Hughes’ estimate that the legacy decline rate fir Bakken wells is 45% and 35% for Eagle Ford wells. And he says a rig can drill 18 wells a year, or about one well every 20.3 days.

The EIA has comes up with different numbers. The data for the chart below was taken from the EIA’s Drilling Productivity Report.

Legacy Decline

The EIA has current legacy decline at about 6.3% per month for Bakken wells and about 7.7% per month for Eagle Ford wells. That works out to be about 54% per year for the Bakken and 62% per year for Eagle Ford. I believe the EIA’s estimate of legacy decline, in this case, is fairly accurate. For instance last month Mountrail County had over 30 new wells completed yet still declined by 6.4%. And in December 2013 North Dakota declined by 5.22% yet had 119 new well completions.

I have examined the last sixteen Directr’s Cuts and gleaned, I think, some important data… I think.

New Well Completions

Rig count has averaged 189 rigs per mnth and has been fairly steady while new well completions has averaged 172 wells per month but has been highly erratic.

New well completions depends far more on weather and fracking crews than rigs. In October there was 650 wells awaiting fracking crews. At 172 wells per month that is almost a four months supply. And that is also what the average spud to completion is, 120 days.

Read More

Texas RRC October Oil & Gas Report

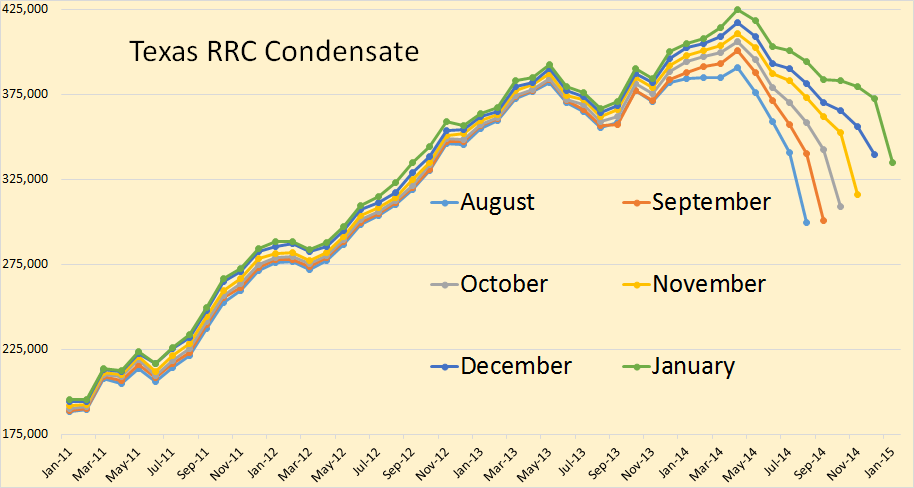
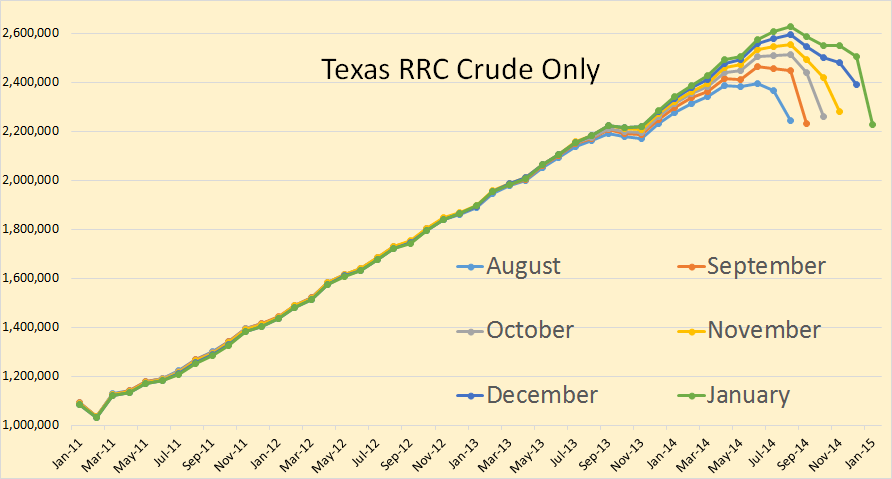
The Texas Railroad Comission has updated their Oil & Gas Production Data Query to include the production numbers for October. The Texas data is always incomplete so the charts all look like there is a big decline in the last few months. This is not the case, the charts only reflect the data that has been received and the production numbers will look a lot more positive after several months.

That being said there is something that can be gleaned from these numbers. Even though the data is incomplete, if production is increasing then last months incomplete numbers should be higher than this months incomplete numbers. Using that logic, there seems to have been a strong slowdown in Texas oil and gas production.

All the last data points are October and is in barrels per day.

Texas Crude Only

In June and July there was a strong increase in production reported to the Tesas RRC by the oil companies. But in August, September and October things slowed down considerably.

Texas Condensate

Texas condensate production has slowed down a lot more than crude. Most Texas condensate comes from their natural gas wells but there are a some wells in the Eagle Ford that produces mostly just condensate.
Read More

Bakken and North Dakota Production Report

The North Dakota Industrial Commission just published their Bakken Monthly Oil Production Statistics and also their ND Monthly Oil Production Statistics.

Bakken Barrels Per Day 2

Bakken production was down 1,598 barrels per day to 1,118,010 bpd. All North Dakota production was down 4,054 bpd to 1,182,174 bpd.

From the Director’s Cut, bold mine:

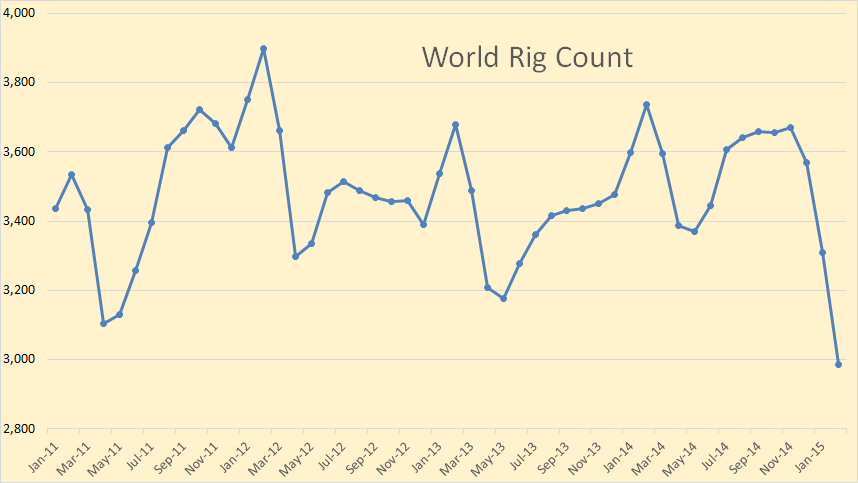
The drilling rig count dropped 2 from September to October, an additional 3 from October to November, and has since fallen 5 more from November to today. The number of well completions decreased from 193(final) in September to 134(preliminary) in October. Three significant forces are driving the slow-down: oil price, flaring reduction, and oil conditioning. Several operators have reported postponing completion work to achieve the NDIC gas capture goals. There were no major precipitation events, but there were 9 days with wind speeds in excess of 35 mph (too high for completion work).

The drillers outpaced completion crews in October. At the end of October there were about 650 wells waiting on completion services, an increase of 40.

Crude oil take away capacity is expected to remain adequate as long as rail deliveries to coastal refineries keep growing.

Rig count in the Williston Basin is set to fall rapidly during the first quarter of 2015. Utilization rate for rigs capable of 20,000+ feet is currently about 90%, and for shallow well rigs (7,000 feet or less) about 60%.

Sep rig count 193
Oct rig count 191
Nov rig count 188
Today’s rig count is 183

Sep Sweet Crude Price = $74.85/barrel
Oct Sweet Crude Price = $68.94/barrel
Nov Sweet Crude Price = $60.61/barrel
Today Sweet Crude Price = $41.75/barrel (lowest since March 2009)

I just checked Rig Count. It now stands at 181 but one of them is drilling a salt water disposal well. So they have 180 rigs drilling for oil right now.

Bakken Wells Producing

Bakken wells producing increased by 118 to 8,602 while North Dakota wells producing increased by 92 to 11,507. Since Bakken wells are included in the North Dakota count this means at least 26 wells outside the Bakken had to be shut down.
Read More

Did Peak Oil Arrive in 2014?

The recent price crash in crude oil, if it lasts for any length of time, will certainly affect oil production. The question is, just how great an effect will it have an how soon? But in this post I want to concentrate on what is, or was, happening to world oil production even before the price crash.

Russia, the largest producer of crude oil in the world, will peak in 2014. There are various estimates of how fast their production will decline but best case, for Russia, puts their decline at about 2% per year. They say they are depending on the Bazhenov Shale and Arctic offshore just to keep production flat in 2015. Well that is not going to happen, not in the next few years anyway. And if prices stay in the current range it is unlikely to ever happen.

OPEC is a wild card but there is little doubt that they are producing flat out right now. Only Iran has any real any real chance of increasing production very much and that only if sanctions are lifted. Libya has already increased production significantly and could increase more but very little. With the violence still going on in Libya, there is a greater chance that their production will decline.

But before we go any further let’s look at what the EIA is predicting for 2015 for both the USA and the rest of non-OPEC? The below charts are from the EIA’s Short-Term Energy Outlook. Current data is through October 2014 and the projected data is through December 2015. All data is in million barrels per day. Also, very important, the data is Total Liquids which includes NGLs, bio fuels and refinery process gain. The EIA, for US production even counts refinery process gain on imported oil.

STOE USA

The EIA is predicting US average production total liquids will be up 1.49 million barrels per day in 2014 and up another 1.1 mbd in 2015. (I always use m for million and k for thousand.)

STOE non-OPEC

The EIA is predicting non-OPEC average total liquids will be up will be up 1.88 mbd in 2014 but only about half that, up .95 mbd, in 2015.

Read More