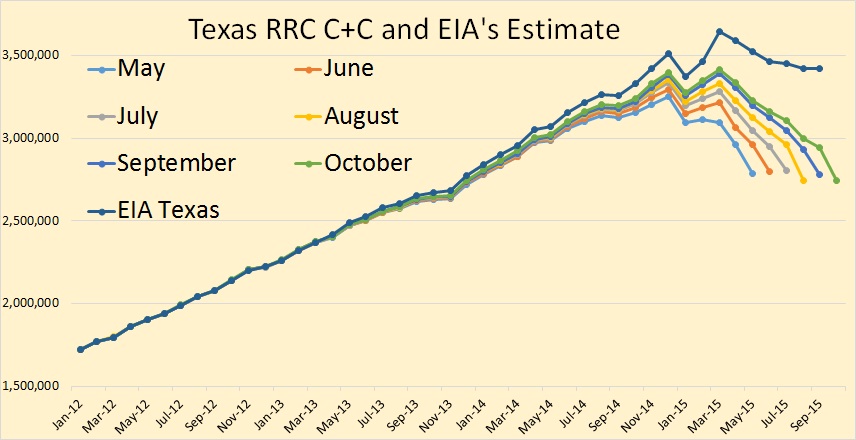
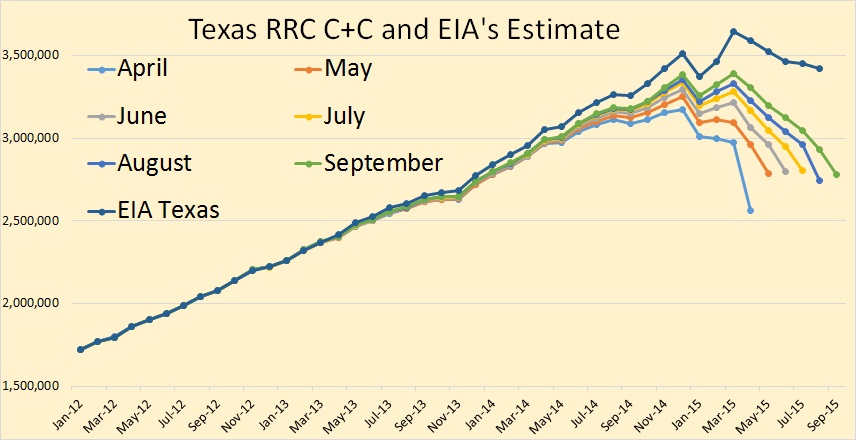
The Texas RRC Oil and Gas Production Data is out. This data is always incomplete. But we can get some idea of what the trend is by comparing it with previous months. This is what I have done in the charts below. If the latest months data is below the previous months data then the trend is down. But if the latest months (incomplete) data is above the previous months (incomplete) data the trend is up.
All RRC data is through November 2015 but the EIA data is only through October. The oil data is in barrels per day.
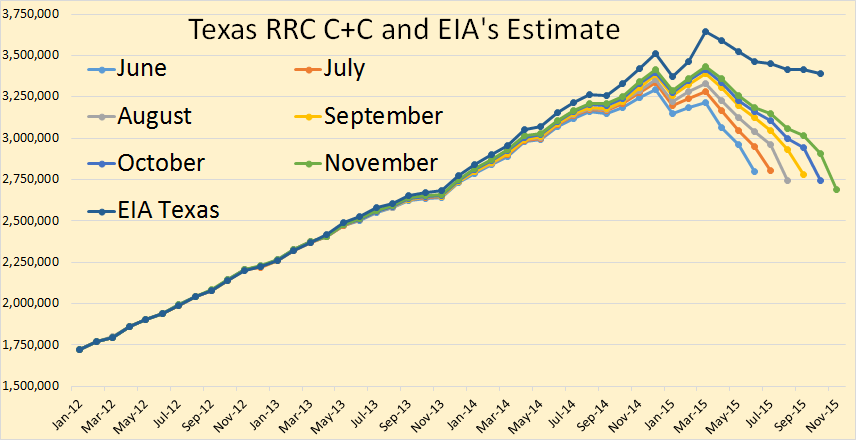
The trend is definitely down. The scale makes it difficult to gauge the month to month change but I have the exact month to month change here in barrels per day. Of course this only gives you a general idea of what is happening. The final change could be either less or greater than the numbers indicate here. But the EIA data should be very close.
Jun. to Jul. 7,245
Jul. to Aug. -63,827
Aug. to Sep. 34,507
Sep. to Oct. -33,486
Oct. to Nov. -52,802
Jun. to Nov. -108,363
EIA Dec. to Oct. -121,000