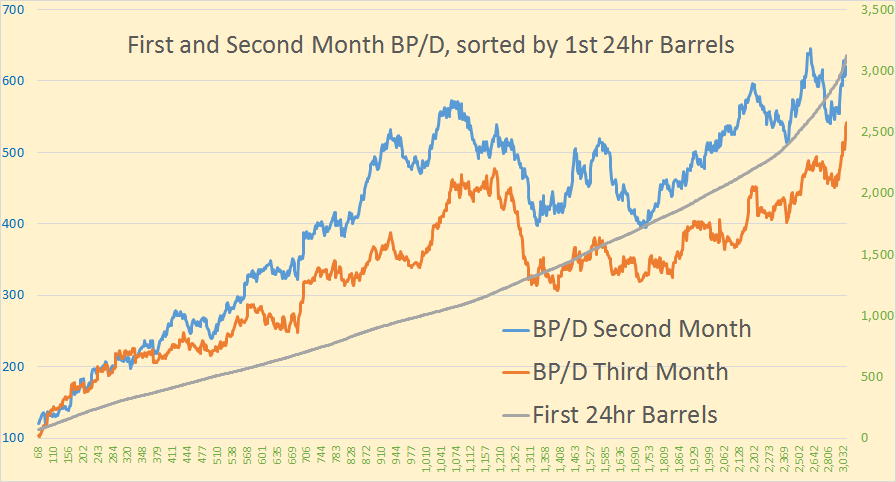
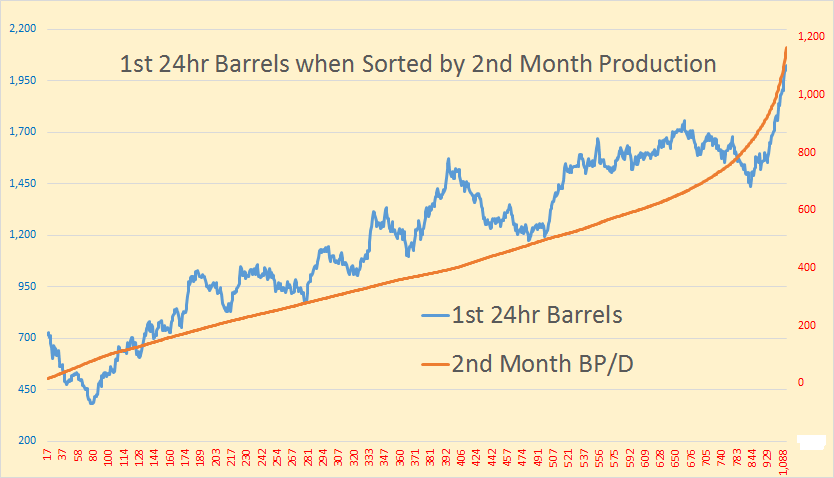
It is has now been confirmed. The first measured 24 hour production from Bakken wells is a very good predictor of the future production of that well. And it has also been confirmed that new wells with higher well numbers are producing a lot less.
In the NDIC’s Daily Activity Reports they publish “WELLS RELEASED FROM “TIGHT HOLE” STATUS” as well as “PRODUCING WELL COMPLETED”. By searching these two lists, then eliminating the duplicates that appear on both lists, we find that perhaps 70 to 80 percent of all wells report their first 24 hours of measured production. It is listed as “BOPD” (Barrels Oil Per Day) and “BWPD” (Barrels Water Per Day). An example below, and notice the second well listed does not give any production numbers:
The “per day” in this case is the first 24 hours of measured production and not necessarily the first 24 hours of preduction. I have collected, from this source, the data from 2,565 wells dating from November 1st 2013 to the present date. Enno Peters gathered data from several thousand Bakken wells dating from the early Bakken t mid 2014. Using the well numbers, I have managed to match 1,127 wells in my database with the same well number in Enno’s data. There were a more matches than this but had no data or incomplete data. But it was mostly because only a little over half my data overlapped his.
From his data I used the 2nd and 3rd months production data because the first month’s data was often for less than one full month. I converted his monthly data to barrels per data by dividing the monthly data by 30.417. There were sometimes great anomalies in the data so to smooth things out, on the first three charts below, I used a 50 well average. Here are the results. The horizontal and right axis is first 24 hour barrels. The “First 24hr Barrels” is a smooth line because that was the sort column.
When I sorted the data by production in the first 24 hours I found a strong correlation with the second months production. This was especially true with first 24 hour production up to 1,050 barrels. The “First 24hr Barrels” chart line is smooth of course because that is the sort index.
Sorting all wells by the second months production we see a very strong correlation to the first 24 hours of measured production.


