World Crude plus Condensate Decline Rate

There is concern that World C+C may decline steeply after the peak, I believe those concerns are over blown. There is always the possibility that there could be a severe recession due to high debt levels, high oil prices or potentially due to both problems in combination. War and environmental damage due to overpopulation are also potential problems which may lead to a crisis.

If none of these problems arises in the near term (say for the next ten years), and demand for oil is high enough to keep annual average oil prices above $75/b from 2018 to 2025, then the average annual decline rate of oil (C+C) output will remain under 2%.

For simplicity in the analysis that follows, I assume the peak in C+C output is 2015 and that output will decline at a relatively steady rate from 2015 to 2025. This in unlikely to be the case in practice and the actual path of future world output is unknown, the intention is to determine a likely trend line for World C+C output.  Using quarterly C+C output data from the EIA, I constructed the charts that follow.

Data is from the International Energy Statistics page at the EIA website.

The “Big 14” oil producers from 2002 to 2015 are (in order from largest to smallest): Russia, Saudi Arabia, United States, China, Iran, Mexico, Canada, UAE, Venezuela, Kuwait, Iraq, Nigeria, Norway, and Brazil. The Rest of the World (ROW) is all other oil producers besides the “Big 14”.
All charts below (except the natural log charts) are in kb/d.

declinepost/

Read More

Texas Oil and Gas Production Declining

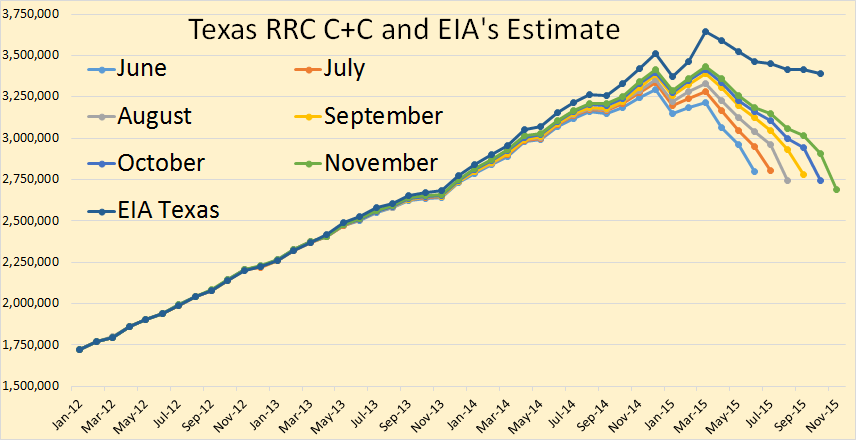
The Texas RRC Oil and Gas Production Data is out. This data is  always incomplete. But we can get some idea of what the trend is by comparing it with previous months. This is what I have done in the charts below. If the latest months data is below the previous months data then the trend is down. But if the latest months (incomplete) data is above the previous months (incomplete) data the trend is up.

All RRC data is through November 2015 but the EIA data is only through October. The oil data is in barrels per day.

Texas C+C

The trend is definitely down. The scale makes it difficult to gauge the month to month change but I have the exact month to month change here in barrels per day. Of course this only gives you a general idea of what is happening. The final change could be either less or greater than the numbers indicate here. But the EIA data should be very close.

Jun. to Jul.  7,245
Jul. to Aug. -63,827
Aug. to Sep. 34,507
Sep. to Oct. -33,486
Oct. to Nov. -52,802
Jun. to Nov. -108,363

EIA Dec. to Oct. -121,000

Read More

Texas RRC July Oil and Gas Report with May Production Numbers

The Texas Rail Road Commission has just released their Oil & Gas Production Data through May. There are four categories of data, Crude, Condensate, Gas Well Gas and Casinghead Gas. Casinghead gas is what most folks call Associated Gas. That is gas that comes up with the oil in oil wells.

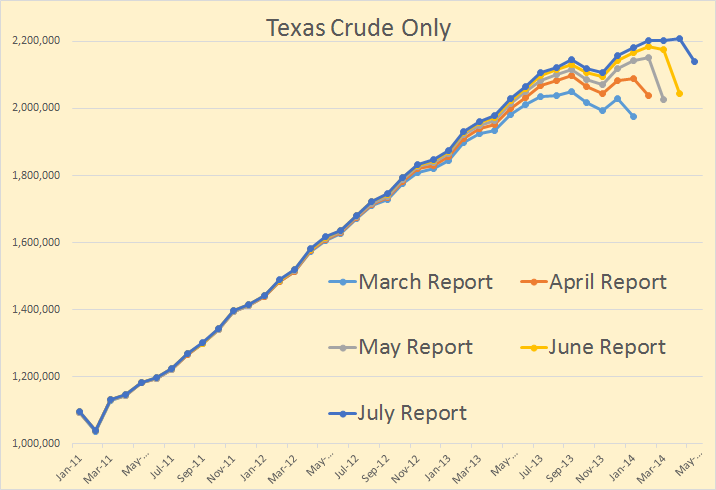
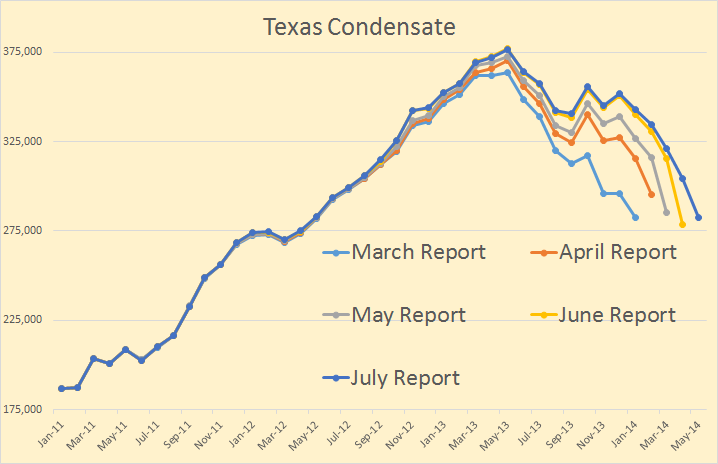
On all oil charts the July Report has data through May 2014 and is in barrels per day. Also the last month, May in this case, is always exaggerated on the low side. That is the data is incomplete back to about two years. But the last month is always far more incomplete than the previous months.

Texas Crude Only

This data is of course incomplete but even from the incomplete data we can get an idea of the average monthly increase. I calculate that Texas Crude only is increasing at about 40,000 barrels per day per month.

Texas Condensate

I think Texas Condensate peaked back in May of 2013 and is now declining at about 500 bp/d per month.
Read More