The EIA’s International Energy Statistics 2

The EIA, a few days ago posted their International Energy Statistics. They publish lots of statistics here but on monthly basis I only follow their  production of world Crude Oil including Lease Condensate.

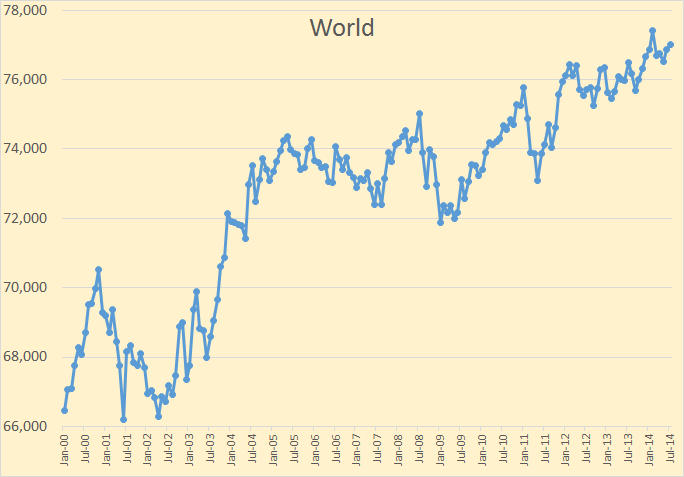
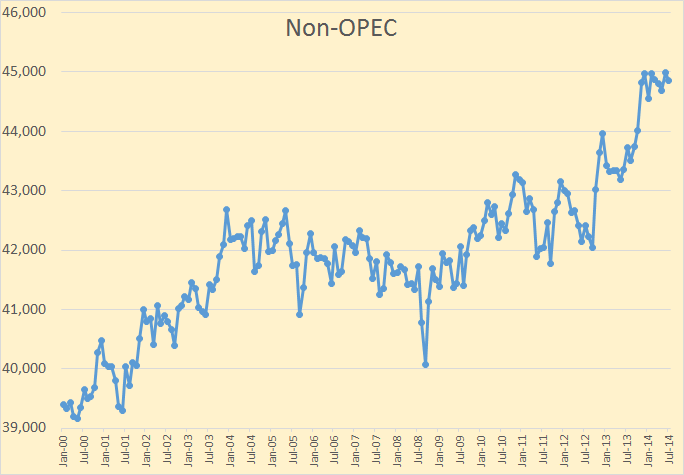
The data on all charts below is Crude + Condensate production through July 2014 and is in thousand barrels per day.

World

World C+C production was up 168,000 bpd to 77,023,000 bpd. The high, so far, was in February at 77,409,000 bpd.

Non-OPEC

Non-OPEC C+C was down 135,000 bpd from it high so far. It has been on a 9 month plateau high.

Read More

The EIA’s International Energy Statistics

The EIA, a few days ago posted their International Energy Statistics. They publish lots of statistics here but on monthly basis I only follow their  production of world Crude Oil including Lease Condensate.

The data on all charts below is Crude + Condensate production through July 2014 and is in thousand barrels per day.

World

World C+C production was up 168,000 bpd to 77,023,000 bpd. The high, so far, was in February at 77,409,000 bpd.

Non-OPEC

Non-OPEC C+C was down 135,000 bpd from it high so far. It has been on a 9 month plateau high.

Read More

Texas RRC Report April Production Data

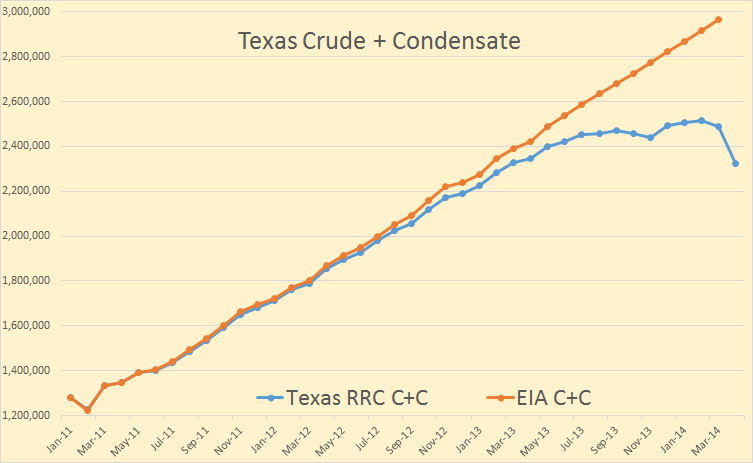
The Texas Rail Road Comission has released their latest report with oil, gas and condensate production for April. The RRC data is always incomplete however and takes many months for the all the data to trickle in. The below chart shows that problem.
Texas RRC-EIA

The data is barrels per data with the EIA data through March and RRC data through April. The EIA has Texas C+C data is highly linear for the 10 months June 2013 through March 2014, increasing at 48 kb/d for 4 months, 41 kb/d for one month then 49 kb/d for the last 5 months.

The EIA has Texas C+C increasing at an average of 48.6 bp/d each month for the last two years. I think that is a little high. I think the production has been increasing at close to 43 kb/d each month but with a recent slow down in that increase.
Texas C+C

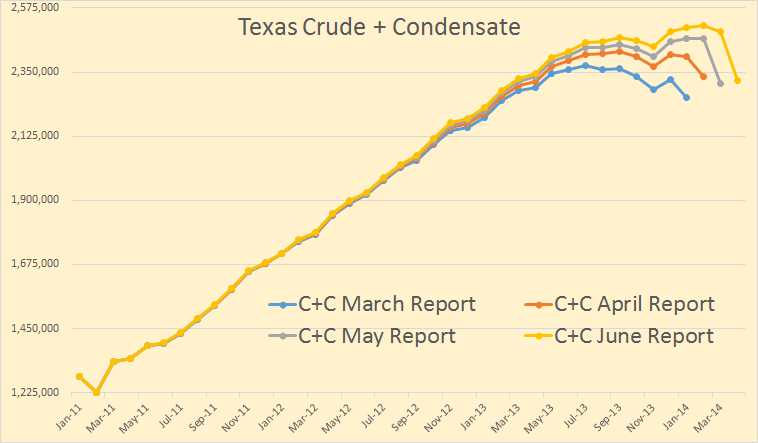
All Texas RRC June report data is through April. The RRC does not combine Crude with Condensate so I have to add the two. But here you can see the problem. Each month the reported data increases with the latest months showing the largest increase. However even if this is the case, the latest month should show an increase almost equal to the final total increase for that month. That was the case in the April Report, (January to February), but not the case for the last two reports.
Read More