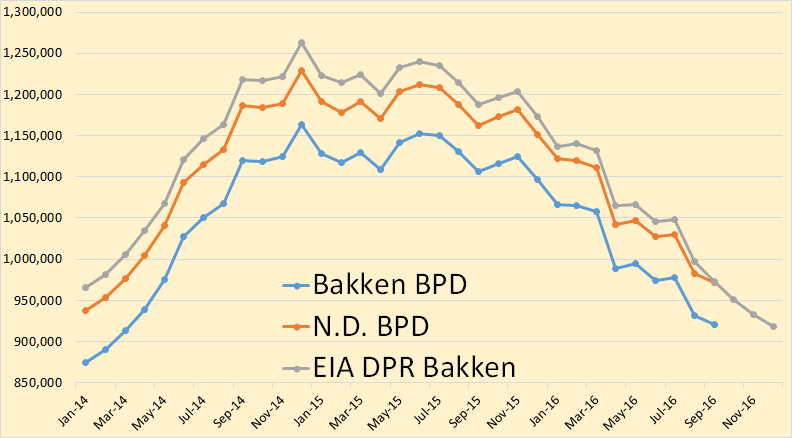
Bakken oil production was down 10,119 barrels per day in September and all North Dakota production was down 10,353 bpd in September.

Bakken production continues to decline though I expect it to level off soon.
Bakken oil production was down 10,119 barrels per day in September and all North Dakota production was down 10,353 bpd in September.

Bakken production continues to decline though I expect it to level off soon.
North Dakota has released August production data for the Bakken and also for all North Dakota.

Bakken production was down 46,433 barrels per day to 930,931 bod, All North Dakota was down 48,695 bpd to 981,039 bpd. This is first time North Dakota has been below 1 million barrels per day since March of 2014.
This is a guest post by David Archibald. The opinions expressed in this post do not necessarily represent those of Dennis Coyne or Ron Patterson
Mexico, China and Beyond
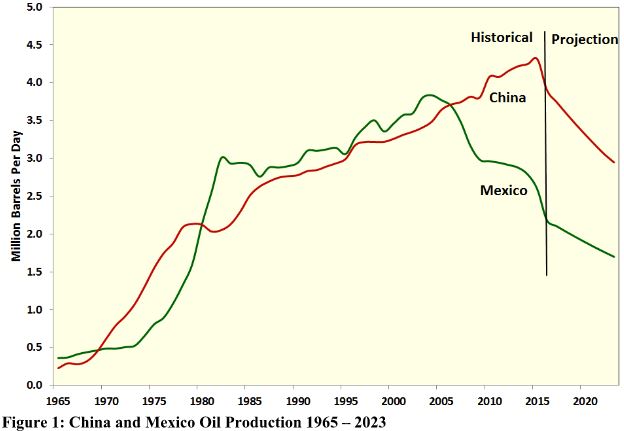
Ron Patterson’s post asking if China’s oil production has peaked reminded me of Mexico
which also produces mainly from supergiant fields. Mexico’s oil production peaked in 2004 and has averaged a 3.5 percent per annum decline rate since, with a peak yearly decline rate of 9 percent in 2008. China’s oil production has fallen 10% from its peak in 2015. Part of that is oil price-related as the Daqing oil field has an operating cost of $46 per barrel and could reverse as the oil price rises. The comparison of China and Mexico with a projection to 2023 is shown in the following figure:

The North Dakota Industrial Commission (NDIC) reported June crude plus condensate (C+C) output on August 12, 2016. North Dakota(ND) Bakken/Three Forks (BTF) output fell by 20.46 kb/d in June to 973.86 kb/d. Overall ND C+C output fell to 1026.58 kb/d in June, a decrease of 185.2 kb/d in the past 12 months. Based on data from Enno Peters, 43 new wells started producing oil in June 2016.
I pulled the charts below from shaleprofile.com (Enno Peter’s website).

by Dennis Coyne
I have attempted to correct the reported Texas output using the methodology provided by Dean. Usually Dean provides the spreadsheets and I simply reproduce his charts with a few comments. This month Dean may be on vacation or busy and I have not yet received his input. If I get his charts I will post them.
Dean uses the average of the correction factors from Jan 2014 to the present in order to reduce the month to month volatility of the correction factors. I tried several averaging methods (all data, 12 month average, 6 month average, and 3 month average) where for the x month average the most recent x months of correction factors were averaged.
The only method with a significant difference was the 3 month average, so I present the “corrected” output using Dean’s usual method and an “Alt (3 month)” alternative. The RRC data and the EIA estimate are also included for reference.
