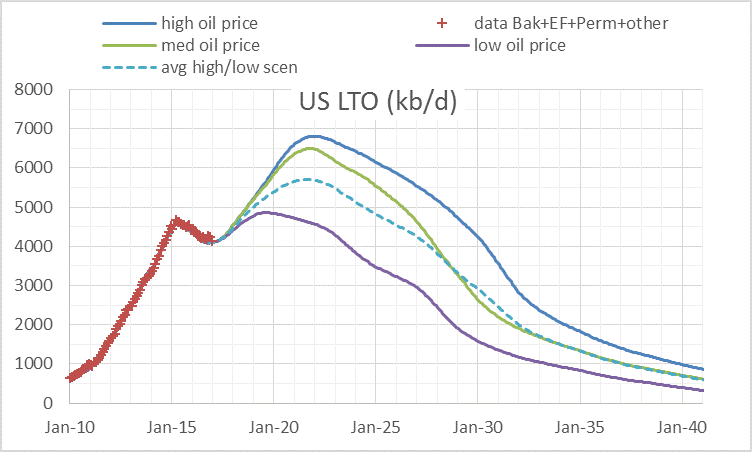
In a previous post on US LTO future output there were suggestions that a bottom up approach might be better than the top down approach and I agree. I will attempt the bottom up approach here. The chart below is a quick summary, based on three different oil price scenarios (high, medium, and low). The dashed line is just the average of the low and high oil price scenarios. Data is from Enno Peters’ website shaleprofile.com and the EIA. (Click on “Tight Oil Production Estimates” for tight oil output data.)
Tag: Bakken
Bakken January Production Data
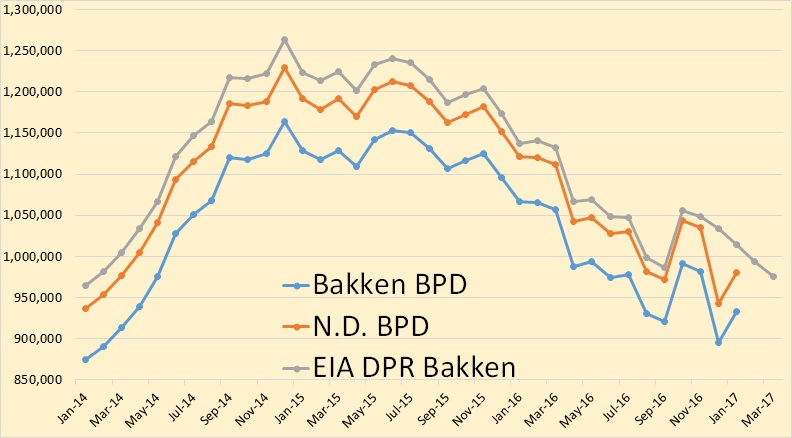
North Dakota has published January production data for the Bakken and for all North Dakota.
Bakken production was up 37,617 bpd to 932,817 bpd while all North Dakota’s production was up 37,972 to 980,294 bpd.
The Future of US Light Tight Oil (LTO)
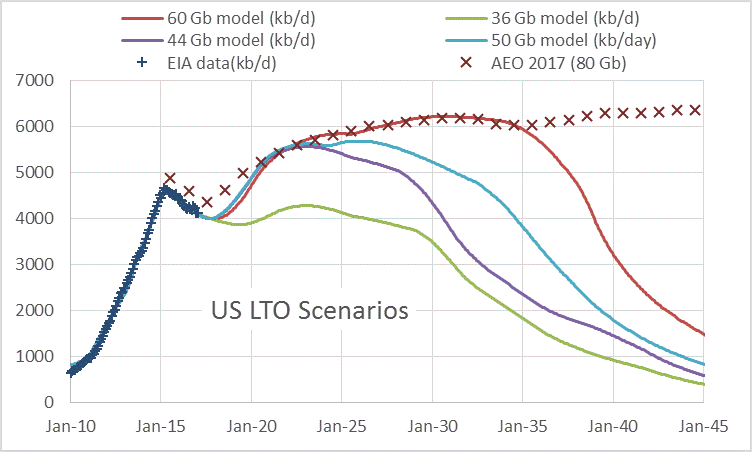
The future output from the light tight oil (LTO) sector of the US oil industry is the subject of much speculation. Above I present some possible future output scenarios based on a simple model of US LTO, the scenarios are compared with the EIA’s 2017 Annual Energy Outlook (AEO) reference scenario with cumulative output of 82 Gb from 2001 to 2050. The cumulative output of the model scenarios is for the same period (2001-2050). Read More
Is The Bakken a Bust?
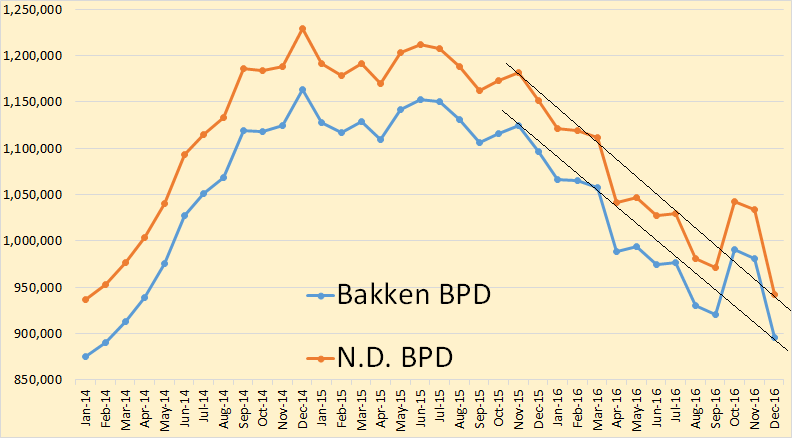
North Dakota has released December production data for the Bakken and for all North Dakota. They were a little shocking.
Bakken production down 86,150 barrels per day 895,330 bpd. North Dakota production down 92,029 bpd to 942,455 bpd. It was noted that this the largest decline ever in North Dakota production. But it should not be overlooked that the October in crease in production was also the largest ever increase in North Dakota production.
Jean Laherrere on Proven Reserves
Jean Laherrere has posted the following charts and comments on Bakken and World oil reserves.
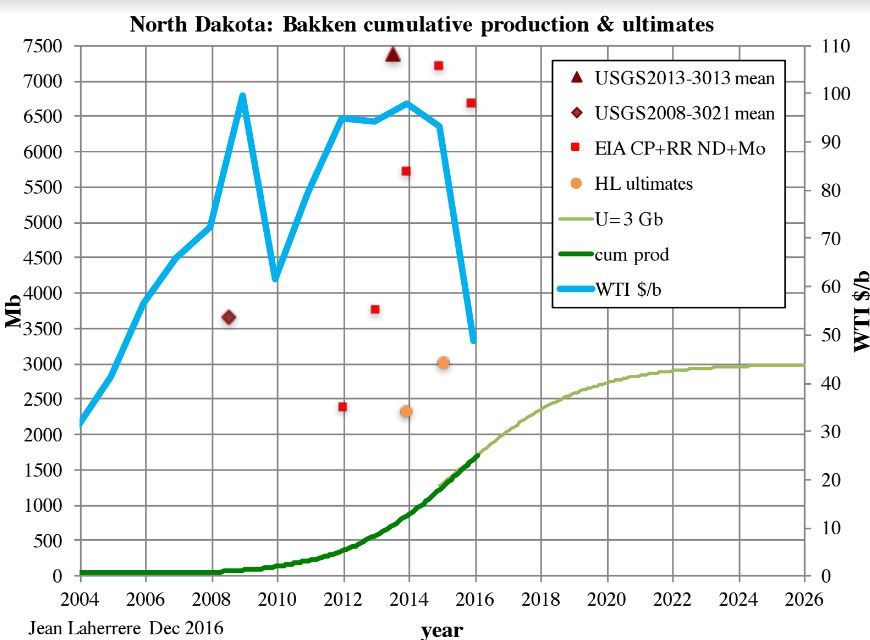
EIA proved reserves on Bakken (ND +Montana) plus cumulative production have changed at end :
-2012 3754 Mb
-2013 5701 Mb
-2014 7203 Mb
-2015 6671 Mb
As shown in this graph in red squares, together with HL ultimates, USGS estimates and cumulative production.
ThisEIA CP+RR value (which is assumed to trend towards the oil ultimate) has increased sharply from 2012 to 2014 and has decreased in 2015 (this decrease may continue towards which value?).