GOM Production and Other News

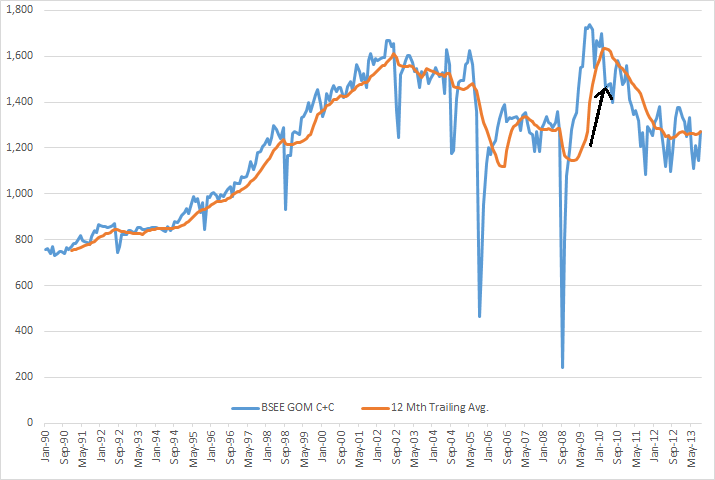
Not much happening on the Peak Oil front these days. I checked out the BSEE Gulf of Mexico production. Data is in kb/d with the last data point September 2013.GOM Production

Average production from the GOM has been relatively flat for the last two and one half years at about 1.260 million barrels per day. The arrow marks April 2010, the month of the Deepwater Horizon disaster.

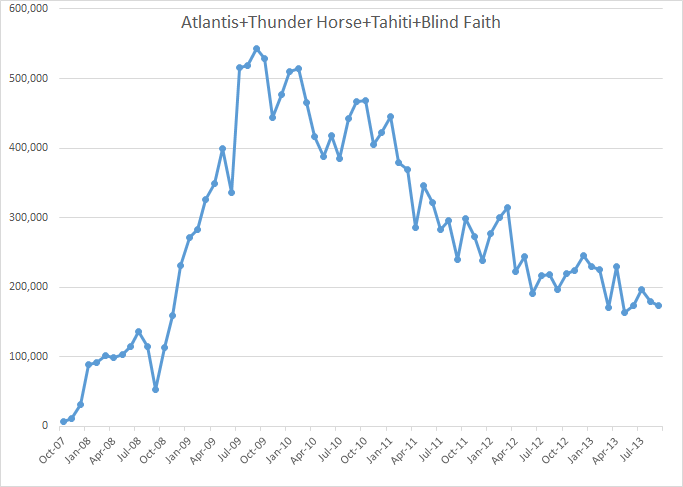
The big deepwater plays continue to decline. I guess they are bringing on other wells in order to keep production flat.

Atl+TH+Tahiti+BF

The above chart is combined liquids production of Atlantis, Thunder Horse, Tahiti and Blind Faith. The last data point is September 2013.

Read More

IN BAKKEN (ND) IT IS NOW MOSTLY ABOUT MCKENZIE COUNTY

This post was originally posted at my blog “Fractional Flow”.

In this post I present an update to my previous posts over at The Oil Drum (The Red Queen series) on developments in tight oil production from the Bakken formation in North Dakota with some additional estimates, mainly presented in charts. The expansion is much about the differences between wells capable of producing, actual producing wells and idle wells (here defined as the difference between the number of wells capable of producing and the number of actual producing wells).


Figure 01: The chart above shows monthly net additions of producing wells (green columns plotted against the rh scale) and development in oil production from Bakken (ND) (thick dark blue line, lh scale) as of January 2000 and as of October 2013. The 12 Month Moving Average (12 MMA) is also plotted (thick dotted dark red line, lh scale).

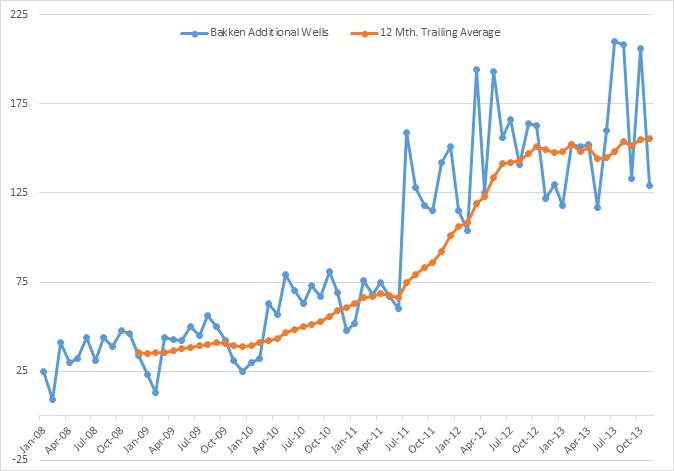
There is still noticeable growth in tight oil production from an accelerated additions of producing wells.

  • For October 2013 North Dakota Industrial Commission (NDIC) reported a production of 877 kb/d from Bakken/Three Forks.
  • In October 2013YTD production from Bakken/Three Forks (ND) was 775 kb/d.
    (It is now expected that average daily production for all 2013 from Bakken (ND) will become around 800 kb/d.
  • The cash flow analysis now suggests less use of debt for manufacturing wells for 2013.
    Major funding for new wells now appears to come mainly from from net cash flows.

kb; kilo barrels = 1,000 barrels

Read More