Bakken Production Data for June + EIA Data

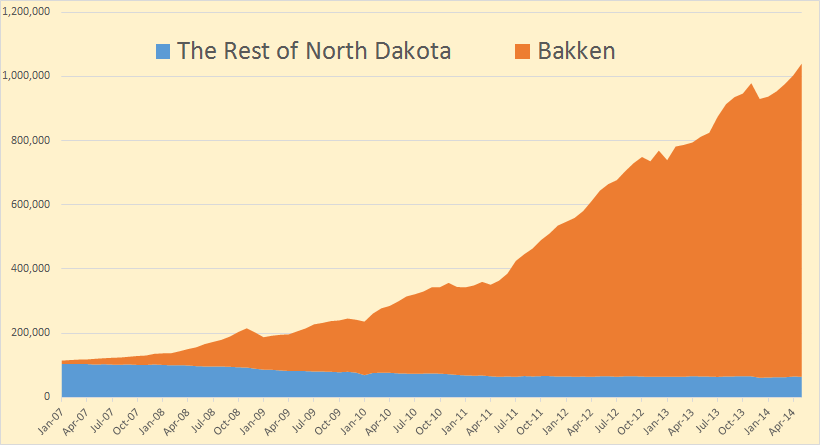
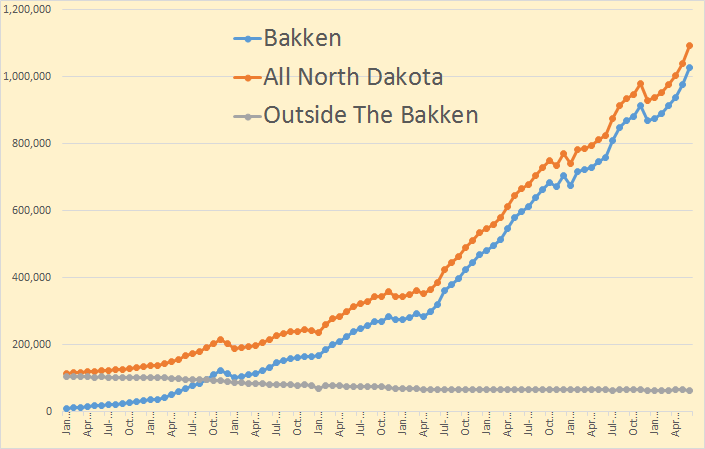
The Bakken and North Dakota production numbers are in for June. There was a big jump in oil production in June. The Bakken was up 53,162 barrels per day to 1,028,352 bpd. All North Dakota was up 52,148 bpd to 1,092,617 meaning the area outside the Bakken was down about 1,000 bpd.

Bakken Barrels Per Day

From the Director’s Cut:

May Sweet Crude Price = $88.31/barrel
June Sweet Crude Price = $90.03/barrel
July Sweet Crude Price = $86.20/barrel
Today’s Sweet Crude Price = $79.50/barrel (all-time high was $136.29 7/3/2008)

The drilling rig count was up one from May to June, and up two more from June to July.
The number of well completions increased as weather impacts eased in June with
significant rainfall on 2 days near Minot and 1 day near Dickinson. However, there were
still 6 to 8 days with wind speeds in excess of 35 mph (too high for completion work).

At the end of June there were about 585 wells waiting on completion services, a decrease
of 25.

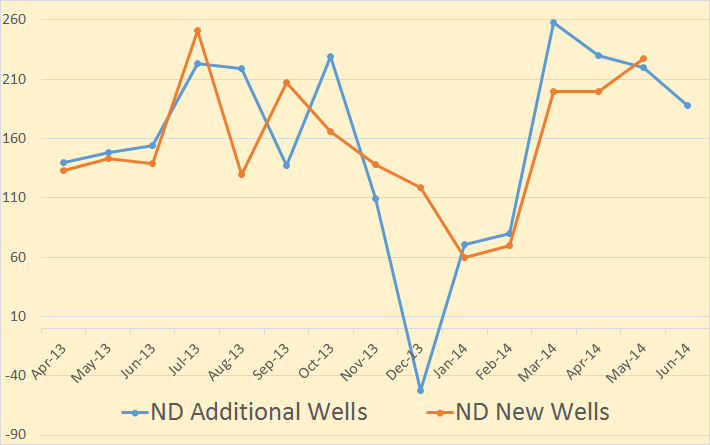
For the first time in a couple of years he did not give us the exact number of new well completions, only that they increased. Last month there were 227 well completions and production was up 37,000 bpd so we can assume there were aroun 235 to 240 new well completions in June.

Well completions should not be confused with “additional wells producing. That is and entirely different figure.

ND New Wells

Additional wells producing is new wells completed, plus previously shut down wells brought back on, line minus wells shut down. Sometimes this number goes negative as it did in December of 2013. That month “Wells Producing” dropped by 52 even though there were 119 new wells completed. All data is barrels per day.
Read More

Enno Peters’ post + EIA DPR Report

The first half of this post is a guest post by Enno Peters. The second half is taken from the latest EIA Drilling Productivity Report.

GEOGRAPHICAL ANALYSIS OF WELL QUALITY IN NORTH DAKOTA

by Enno Peters

SUMMARY

I was interested in doing a geographical analysis of the oil production in North Dakota. Detailed information made freely available by the NDIC allowed me to analyze how, geographically, wellperformance has been changing over time, in the area of North Dakota where most oil is produced.

RESULTS

In the following animated gif, you will see part of North Dakota. It contains the North West corner that borders Montana and Canada. The scale is in miles, with a rather arbitrary origin. Projected on this map is a contour map. The numbers of these contours are the cumulative 1 year returns for wells drilled within that area, and the unit is 1000 barrels of oil (no gas). For example, contours with the value 50 mark the area in which wells produced at least 50 k barrels of oil in their first year.

animated (1)

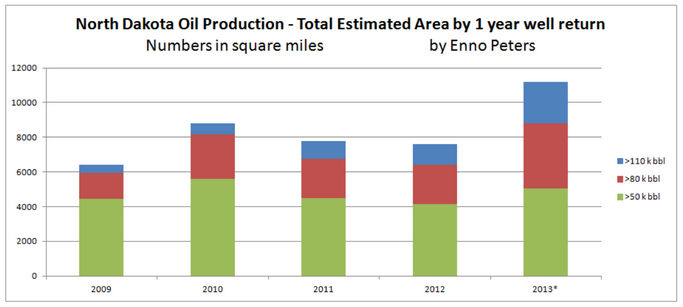
I could calculate the surface areas of several levels of first year well returns, in order to determine the trend of these areas. In the following chart you can see for each year the (estimated) surface volumes for 3 levels of first year well returns, 50k, 80k, and 110 k barrels of oil.

Enno's Chart

The sudden increase in 2013 of estimated productive surface area, in which wells could produce at least 50 k barrels of oil in their first year, may be explained by

1) the fact that I could only use data until June 2013 (as the 2014 May data is currently the latest one available), and therefore the number of data points are 1/3 of what I have for 2012. The method to determine the contours may not be suitable with this number of data points.

2) changing well practices

3) entering of new formations

So far I suspect that it is mostly 1), but that 2) and 3) could also be part of the answer, and therefore recommend to mostly ignore the 2013 results for now.

As a guide to interpret these results, I estimate (based on a discounted cash flow analysis) that a well that returns 50 k barrels of oil needs a minimum WTI price of about $120; about $82 WTI is needed for 80 k wells or better, and a well that returns 110 k barrels of oil in its first year is about even with $64 WTI. These are rough indications; I have seen a good analysis that estimates 10% higher required WTI prices for these levels of well performance. With current prices that would mean that 50 k wells are not profitable, while 80+ k wells clearly are.

I further estimate that the estimated total oil return (EUR) of a well is just over 4 times its first year return.
Read More

EIA Petroleum Supply Monthly

The EIA has released its Petroleum Supply Monthly with C+C production numbers through May 2014. Of all the EIA data releases this seems to be the most accurate. However in some cases it is only as good as a few EIA employees guesses. And the more state data they have to work with, the better their guess.

The data in this report goes back to 1920 for total US production and to 1981 for individual states and offshore production. However I have chosen to shorten the time frame for my charts in order to better show what has happened recently.

USA

US production was down 36,000 bp/d in May to 8,357,000 barrels per day. US production took off in mid 2011 when Shale production took off and has risen some 3,300,000 since. Of course there was shale production prior to this but it was only keeping US production on a relatively flat plateau.

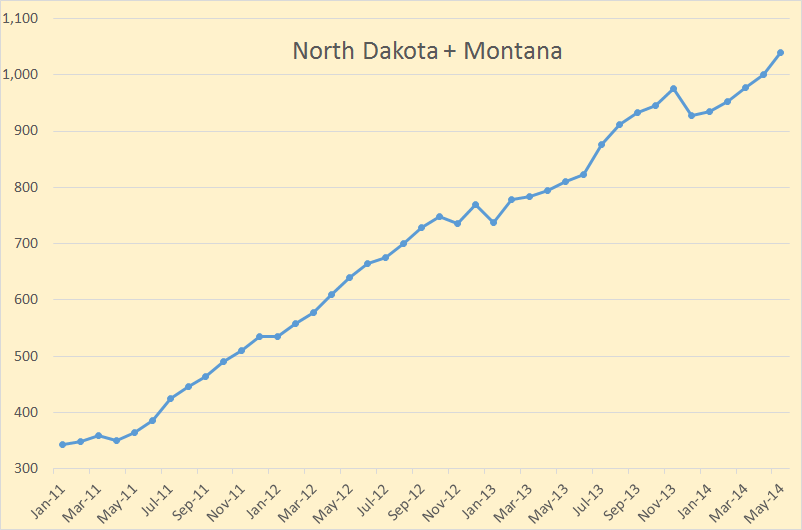
ND and Montana

Everyone is interested in the Bakken so I have combined the two Bakken states. Of course there is production in these two states outside the Bakken but this is the best I could do. Note that when the Bakken has one bad month as they had in December, it takes several months to get back to their prior production level.

Read More

Bakken, North Dakota & Production by County

North Dakota published their Bakken Production Data yesterday along with their North Dakota Production Data. This all happened the same day the EIA’s Drilling Productivity Report came out. This has resulted in two post in two days.

All charts below are in barrels per day with the last data point May 2014 even though the horizontal axis may only go through April 2014.

What type of chart is preferable to most folks, the below type?

Bakken Stacked

Or this type?

Bakken Barrels Per Day

This was a good month for the Bakken. Production was  up 36,653 bp/d to 974,695 bp/d. All North Dakota was up 36,379 bp/d to 1,039,635 bp/d. This meant that North Dakota production outside the Bakken was down 274 bp/d to 64,940 bp/d.

From the Director’s Cut, bold mine:

The drilling rig count was up slightly from April to May, and from May to June the rig
count increased by one. The number of well completions increased 14% to 227, but weather continued to impact activity in May with 2 days of heavy rain near Dickinson and 5 to 6 days with wind speeds in excess of 35 mph (too high for completion work).

At the end of May there were about 610 wells waiting on completion services, an
increase of 10.
Read More

North Dakota and the Bakken by County

Looking at North Dakota oil production by county, and historical production by county, gives a better  perspective of what is happening in the Bakken and the rest of North Dakota than just looking at total production.

The data is available here: ND Historical Barrels of Oil Produced by County You will notice it says:(Confidential Wells are Not Included). However the total North Dakota does include confidential wells. And I have made adjustments for the confidential wells. The adjustment for March and April came from the NDIC here: State Summary Report April 2014.
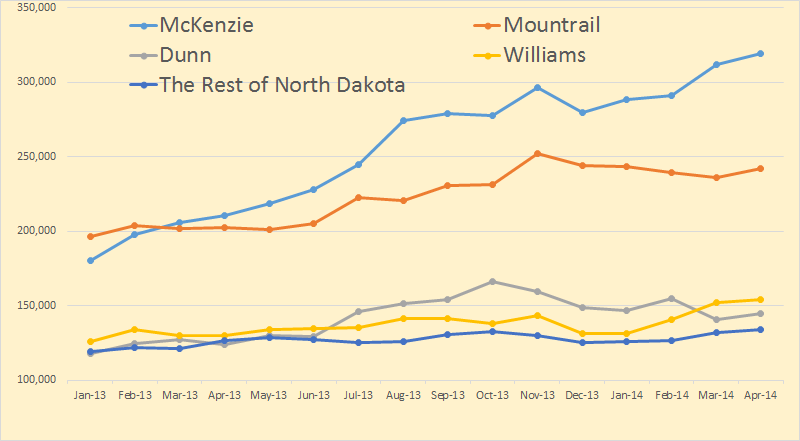
Bakken Counties

The above chart is after adjustment for confidential wells. Even the lowest producer of the big four, Dunn County, outproduces the rest of North Dakota combined.

McKenzie

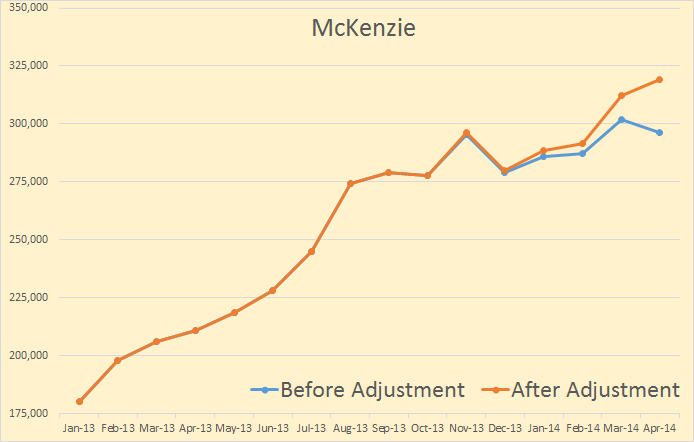
McKenzie was up 7,168 barrels per day after adjustment this month.
Read More