US Production and Imports and an Essay

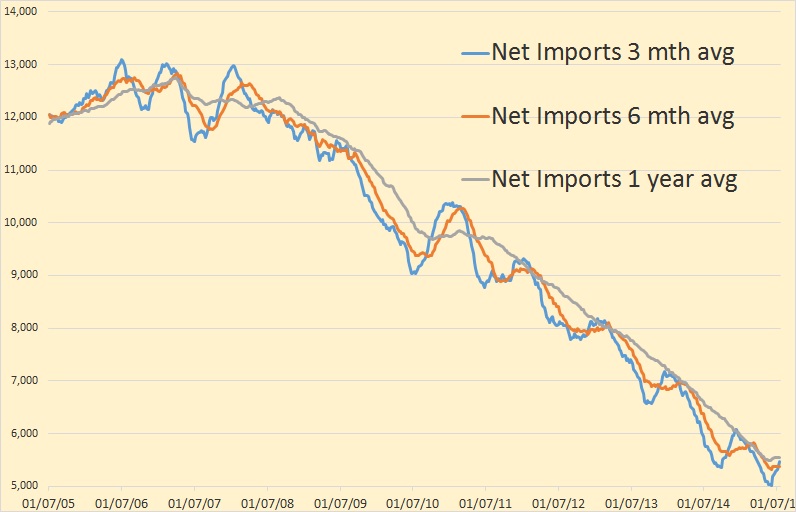
Even before the shale revolution got underway, US net imports were falling. The data below is from the Weekly Petroleum Status Report and is in thousand barrels per day.

Net Imports

This chart shows net crude oil and petroleum products imports. Net imports peaked in 2006 and started to fall in earnest in 2008. They continued to fall until 2010 when the three month average increased sharply and the annual average leveled out for about a year. Then as the Light Tight Oil revolution got underway in 2011, net imports started to fall again.

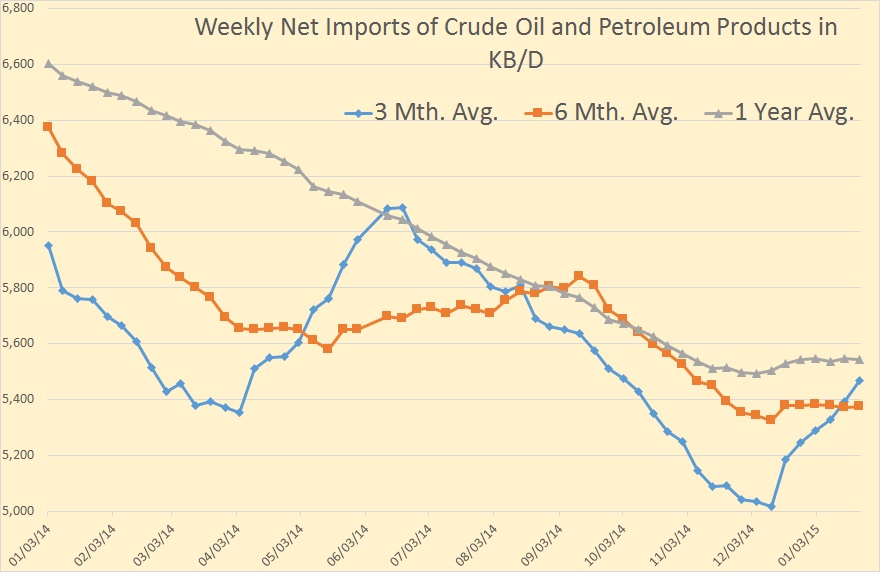
The chart above shows net imports bottom out in late spring, March and April and heads back down again in June. Below is the last year of that chart amplified.

Weekly Net Imports

But in December of 2014 net imports broke their trend and headed sharply up, about four months earlier than normal. Much of this increase in imports had to be caused by declining US production though part of it could be caused by increased consumption because of low prices.
Read More

Are Mountrail’s Sweet Spots Past Their Prime?

This is a Guest Post by Rune Likvern   Fractional Flow

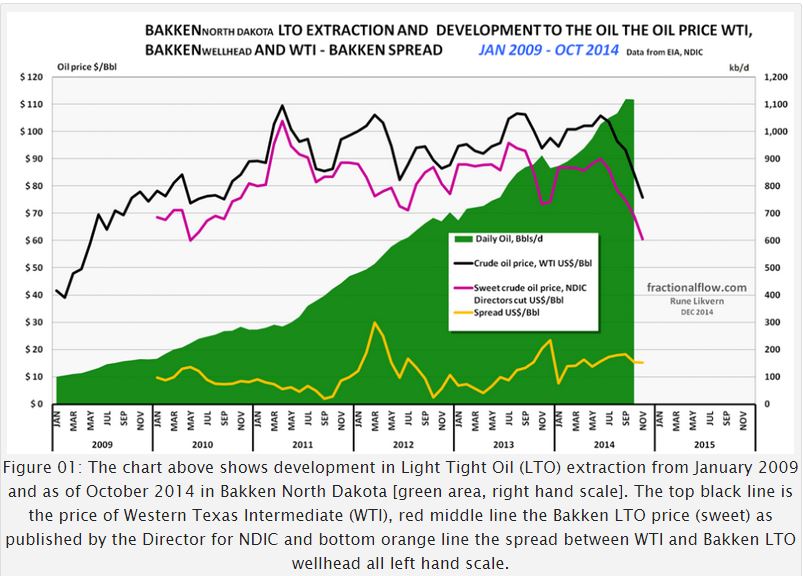
This post is an update on total Light Tight Oil (LTO) extraction from Bakken in North Dakota based upon actual data as of October 2014 from North Dakota Industrial Commission (NDIC). It further presents a statistical analysis on developments of well productivity with a detailed look at developments in Parshall, Reunion Bay and Sanish.

  • There were general improvements in LTO well productivity in Bakken during 2013.
  • Present trends in LTO well productivity for Mountrail’s sweet spots (Alger, Parshall, Reunion Bay, Sanish and Van Hook) suggests these are past their prime.
  • Figure 29 in this post show development in well productivity for Alger and Van Hook and figures 06, 08 and 10 for Parshall, Reunion Bay and Sanish. A common feature for Parshall, Reunion Bay, Sanish, and Van Hook is that these reached new highs in well productivity for wells started in 2013.
    Alger has been in general decline since 2011.
  • LTO extraction in recent years may be viewed as a source for global swing production for oil.
Rune 1NOTE: Actual data used for this analysis are all from North Dakota Industrial Commission (NDIC). Data are incomplete for around 2% of the wells.

For wells on confidential list, data on runs were used as proxies for extraction.

Production data for Bakken, North Dakota: Monthly Production Report Index

Formation data from: Bakken Horizontal Wells By Producing Zone

The important messages from this analysis are the trends in well productivity.

This post is an update and expansion of my post “Will the Bakken “Red Queen” Have to Run Faster?” from the summer of 2013 and may be read as a continuation of my post “Will the Bakken Red Queen Outrun Growth in Water Cut?”.

Rune 2a Read More

What Will 2015 do for Peak Oil?

The Cornucopians are exuberant, they believe that collapsing of oil prices dealt the death knell for peak oil. An oil glut, they say, is what we have, not peak oil. But an oil glut is exactly what we would expect at the very peak. After all, that is what peak oil is, that is the the point in time when the world produces more oil than ever in history… and the most it ever will produce.

I am of the firm conviction that the world is at the peak of world oil production right now, or was at that point three or four months ago. I think history will show that the 12 months of September 2014 through August 2015 will be the one year peak. Whether the calendar year peak is 2014 or 2015 is the only thing still in question, or that is my opinion anyway.

The EIA says, in their Short Term Energy Outlook says US Crude oil will peak, at least temporarily, in May 2015.

STEO 1

Looking at the area breakdown for total US production:

STEO Total US

This chart includes net US crude oil imports. Notice how they expect crude oil imports to bottom out in February of 2015 at 5.78 mbd then increase to 6.71 mbd in August before declining to 5.82 mbd in December.

Read More

Bakken, Let’s Do The Math

There has been considerable dispute over how many new wells required to keep production flat in the Bakken and Eagle Ford. One college professor posted, over on Seeking Alpha, figures that it would take 114 rigs in the Bakken and 175 in Eagle Ford to keep production flat. He bases his analysis on David Hughes’ estimate that the legacy decline rate fir Bakken wells is 45% and 35% for Eagle Ford wells. And he says a rig can drill 18 wells a year, or about one well every 20.3 days.

The EIA has comes up with different numbers. The data for the chart below was taken from the EIA’s Drilling Productivity Report.

Legacy Decline

The EIA has current legacy decline at about 6.3% per month for Bakken wells and about 7.7% per month for Eagle Ford wells. That works out to be about 54% per year for the Bakken and 62% per year for Eagle Ford. I believe the EIA’s estimate of legacy decline, in this case, is fairly accurate. For instance last month Mountrail County had over 30 new wells completed yet still declined by 6.4%. And in December 2013 North Dakota declined by 5.22% yet had 119 new well completions.

I have examined the last sixteen Directr’s Cuts and gleaned, I think, some important data… I think.

New Well Completions

Rig count has averaged 189 rigs per mnth and has been fairly steady while new well completions has averaged 172 wells per month but has been highly erratic.

New well completions depends far more on weather and fracking crews than rigs. In October there was 650 wells awaiting fracking crews. At 172 wells per month that is almost a four months supply. And that is also what the average spud to completion is, 120 days.

Read More

Bakken, A Tale of Two Counties

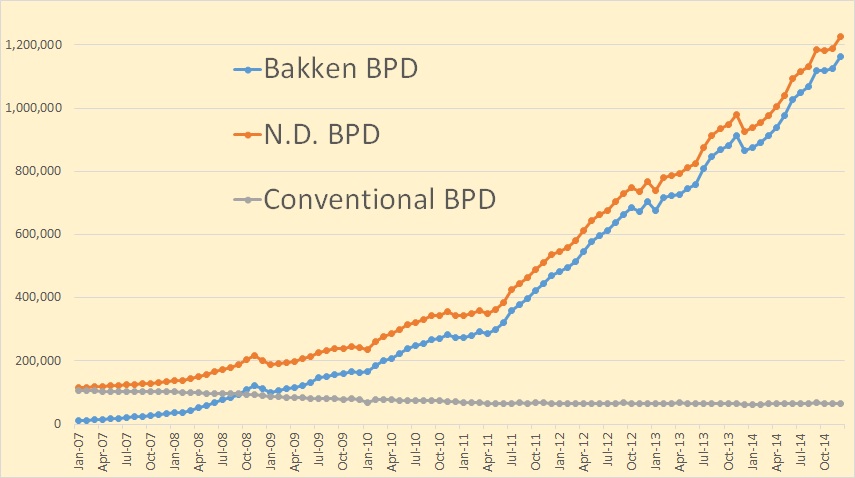
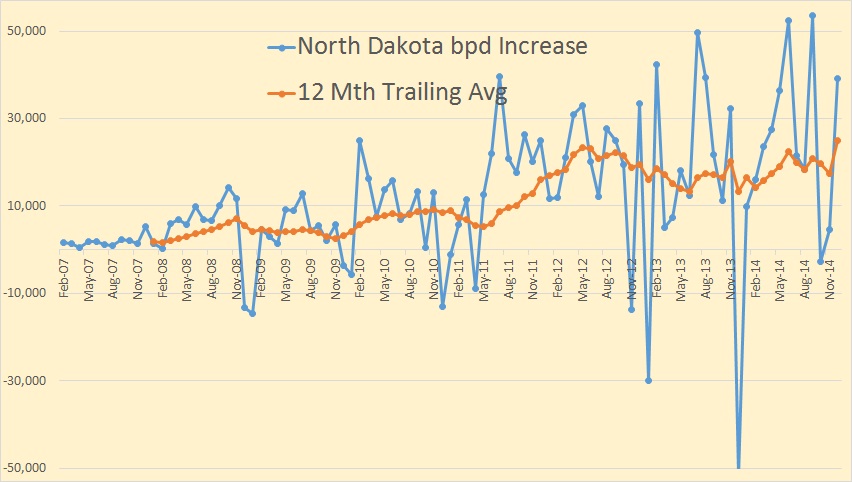
North Dakota publishes their Historical Barrels of Oil Production by County which gives county by county production back to 1951. The data here does not include confidential wells but they publish the last couple of months production data that does include confidential wells here: Oil and Gas Production Report. Looking over this data I found something very strange. In October Bakken production was down by 1,598 barrels per day and all North Dakota was down by 5,4054 barrels per day.

All data is in barrels per day with the last data point October 2014.

McKenzieMcKenzie County was up 19,609 barrels per day or 4.88 percent. In October McKenzie was up even more than it was in September when the Bakken was up 52.5 thousand barrels per day.

Mountrail

Mountrail Countywas down 18,728 barrels per day or 6.42 percent. There is  more on this story below.

Dunn

Dunn County was down 3,527 barrels per day or 1.83 percent.
Read More