February World and Non-OPEC Oil Production

By Ovi

The focus of this post is an overview of World oil production along with a more detailed review of the top 11 Non-OPEC oil producing countries. OPEC production is covered in a separate post.

Below are a number of Crude plus Condensate (C + C) production charts, usually shortened to “oil”, for the oil producing countries. The charts are created from data provided by the EIA’s International Energy Statistics and are updated to February 2025. This is the latest and most detailed/complete World oil production information available. Information from other sources such as OPEC, the STEO and country specific sites such as Brazil, Norway, Mexico, Argentina and China is used to provide a short term outlook. 

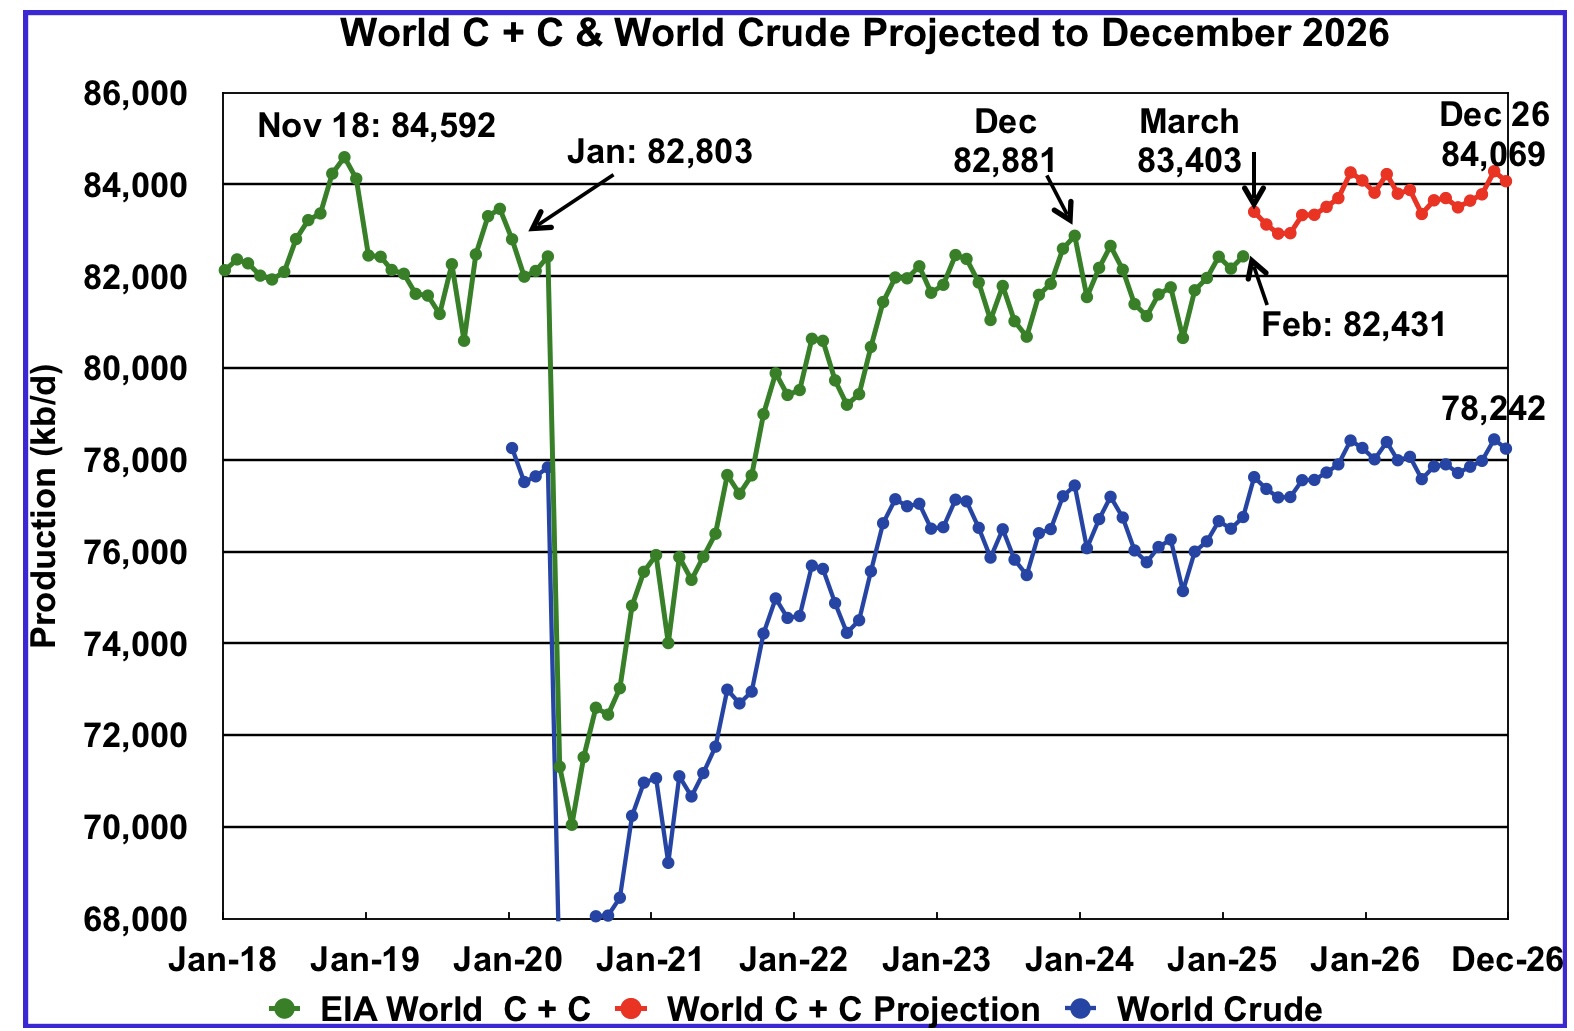
World oil production increased by 267 kb/d in February to 82,431 kb/d, green graph. The largest increase came from the Kazakhstan, 254 kb/d largely ‘offset by Canada’s drop nof 232 kb/d. March World oil production is projected to increase by 972 kb/d to 83,403kb/d.

Read More

US March Oil Production at New High

By Ovi

All of the Crude plus Condensate (C + C) production data, oil, for the US state charts comes from the EIAʼs Petroleum Supply monthly PSM which provides updated production information up to March 2025.

U.S. March oil production increased by 248 kb/d to 13,488 kb/d, a new high. The largest increases came from Texas and New Mexico.

Read More

US February Oil Production Marginally Higher

By Ovi

All of the Crude plus Condensate (C + C) production data, oil, for the US state charts comes from the EIAʼs Petroleum Supply monthly PSM which provides updated information up to February 2025.

U.S. February oil production increased by 29 kb/d to 13,159 kb/d, 149 kb/d lower than December 2023’s 13,308 kb/d. The largest increases came from Texas and New Mexico. January’s production was revised down from last month’s 13,146 kb/d to 13,130 kb/d a decrease of 16 kb/d which is more than one half of February’s increase.

Read More

January’s US Oil Production Drops Big

By Ovi

All of the Crude plus Condensate (C + C) production data, oil, for the US state charts comes from the EIAʼs Petroleum Supply monthly PSM which provides updated information up to January 2025.

U.S. January oil production decreased by 305 kb/d to 13,146 kb/d, 158 kb/d lower than December 2023. The largest decreases came from Texas and New Mexico. December production was revised down from last month’s 13,491 kb/d to 13,451 kb/d a decrease of 40 kb/d. Production in February is expected to increase by 392 kb/d.

Read More

U.S. November Oil Production Drops to Year Ago Level

By Ovi

All of the Crude plus Condensate (C + C) production data, oil, for the US state charts comes from the EIAʼs Petroleum Supply monthly PSM which provides updated information up to November 2024.

U.S. November oil production decreased by 122 kb/d to 13,314 kb/d, only 6 kb/d higher than December 2024. The largest decreases came from Texas, 70 kb/d, New Mexico 38 kb/d and the GOM 108 kb/d.

Read More