The EIA’s Short Term Energy Outlook is out. The data is in million barrels per day.

Not much has changed in the EIA’s projection since last month, however their projection for the remainder of this year and next year has increased slightly.
The EIA’s Short Term Energy Outlook is out. The data is in million barrels per day.

Not much has changed in the EIA’s projection since last month, however their projection for the remainder of this year and next year has increased slightly.
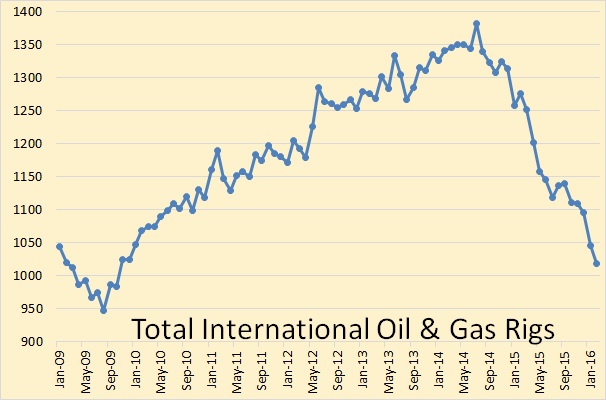
The Baker Hughes International Rig Count is out.
The rig count data in all charts below is through February 2016.

The Baker Hughes International Rig Count does not include the US, Canada, any of the FSU countries or inland China. It does include offshore China. That rig count peaked in July 2014 at 1,382 rigs and in February stood at 1,018, down 364 rigs from the peak.
The monthly Baker Hughes International Rig Count came out a few days ago. Baker Hughes international rig counts do not include US, Canada, FSU countries or on shore China. All rig count data here is through December 2015 and includes all rigs, gas, oil and misc.

Total international rig count was down 14 rigs from November to December. From December 2014 to December 2015 rig count was down 218 rigs or 16.6 percent.
The Baker Hughes International Rig Count is out. I have decided to try something new with the charts. That is to compare the current year’s rig count with the previous two years count and to insert, within the charts, the percent change for this year as compared to last year. Also, this is the total rig count, Oil and Gas. Also the charts are not zero based. I do this in order to better emphasize the monthly change.
July usually sees a big jump in rig counts. This year there was a very tiny July increase, only a fraction of the increase we usually see for July.
*The Total International rig counts does not include the USA, Canada or the FSU. The Total International rig count was down 28 in July to 1118. Last July it was up3 to 1344.
There has been considerable dispute over how many new wells required to keep production flat in the Bakken and Eagle Ford. One college professor posted, over on Seeking Alpha, figures that it would take 114 rigs in the Bakken and 175 in Eagle Ford to keep production flat. He bases his analysis on David Hughes’ estimate that the legacy decline rate fir Bakken wells is 45% and 35% for Eagle Ford wells. And he says a rig can drill 18 wells a year, or about one well every 20.3 days.
The EIA has comes up with different numbers. The data for the chart below was taken from the EIA’s Drilling Productivity Report.
The EIA has current legacy decline at about 6.3% per month for Bakken wells and about 7.7% per month for Eagle Ford wells. That works out to be about 54% per year for the Bakken and 62% per year for Eagle Ford. I believe the EIA’s estimate of legacy decline, in this case, is fairly accurate. For instance last month Mountrail County had over 30 new wells completed yet still declined by 6.4%. And in December 2013 North Dakota declined by 5.22% yet had 119 new well completions.
I have examined the last sixteen Directr’s Cuts and gleaned, I think, some important data… I think.
Rig count has averaged 189 rigs per mnth and has been fairly steady while new well completions has averaged 172 wells per month but has been highly erratic.
New well completions depends far more on weather and fracking crews than rigs. In October there was 650 wells awaiting fracking crews. At 172 wells per month that is almost a four months supply. And that is also what the average spud to completion is, 120 days.