The EIA Short Term Energy Outlook (STEO) was published recently. An estimate for World C+C output from 2015 to 2026, with forecast values for 2024 to 2026 based on the recent STEO n chart below. A slightly different methodology was used this month by looking at World C+C minus US C+C from the EIA’s International Energy Statistics and World crude minus US Crude as reported in the STEO to find World minus US condensate output. The trend for the condensate data from 2018 to 2023 was used to project condensate from 2024 to 2026 for World minus US and then the forecast for US C+C was added to the World minus US crude forecast along with the condensate forecast to arrive at World C+C.
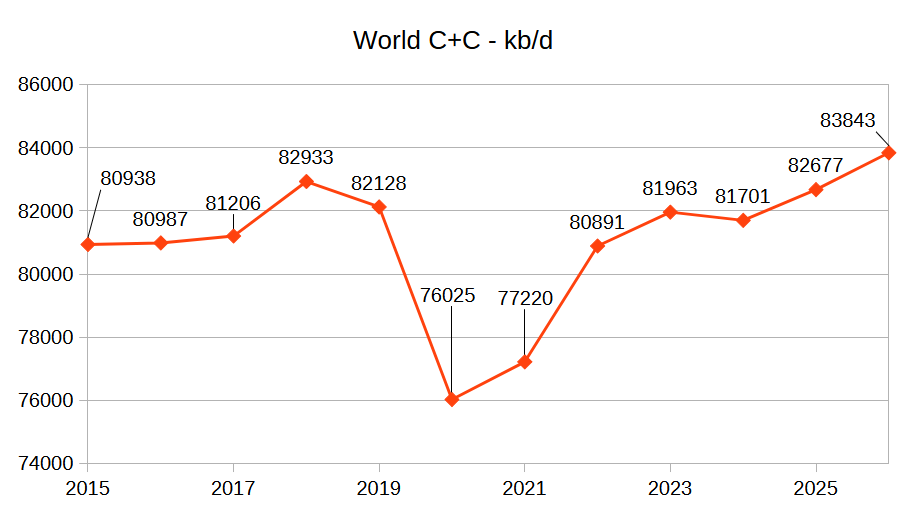
World C+C increases by 2142 kb/d from 2024 to 2026 an annual increase of 1071 kb/d. The growth rate looks optimistic especially when the low prices of the STEO forecast are considered. Last month’s estimates were 81861, 83229, and 84460 for 2024, 2025 and 2026 respectively, so the estimates are all lower this month compared to last month.
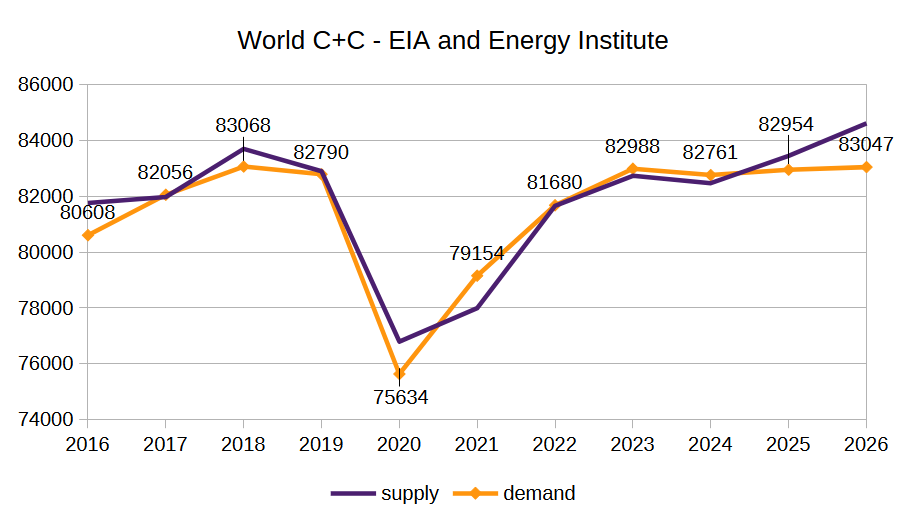
The demand estimate above is the EIA and Energy Institute estimate from my previous post, the supply curve is adjusted 770 kb/d higher to coincide with the Energy Institute C+C estimate from 2015 to 2023, the 770 kb/d is also added to my 2024 to 2026 forecast in the previous chart. I expect the 2026 forecast (84613 kb/d in the chart above) is at least 1000 kb/d too high.
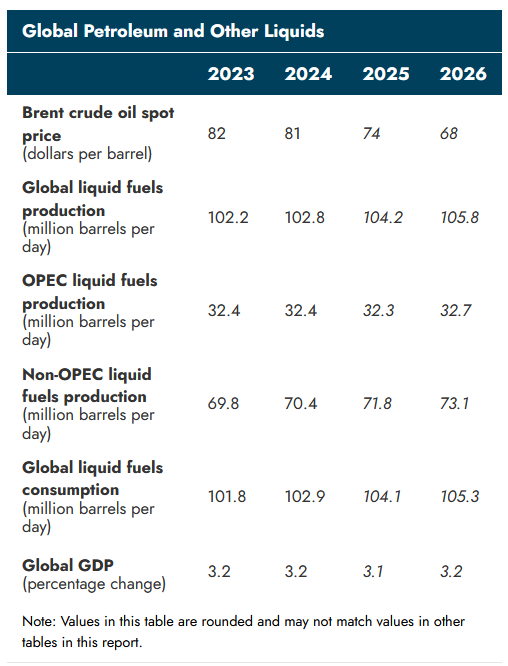
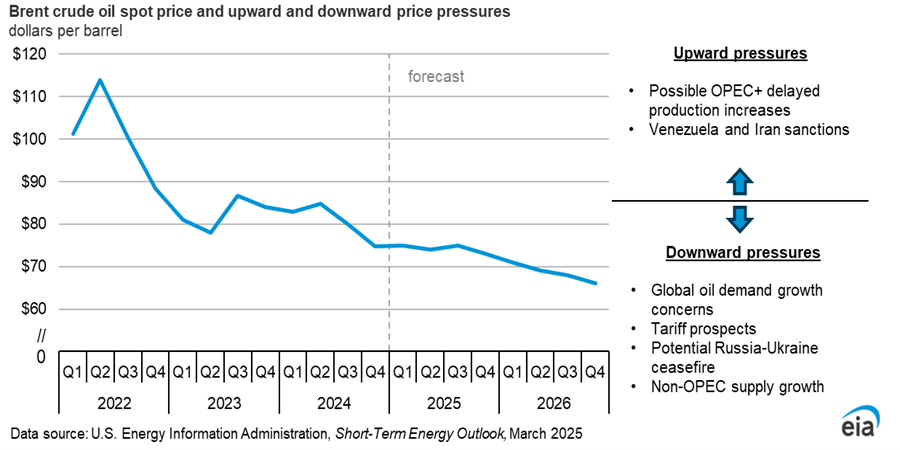
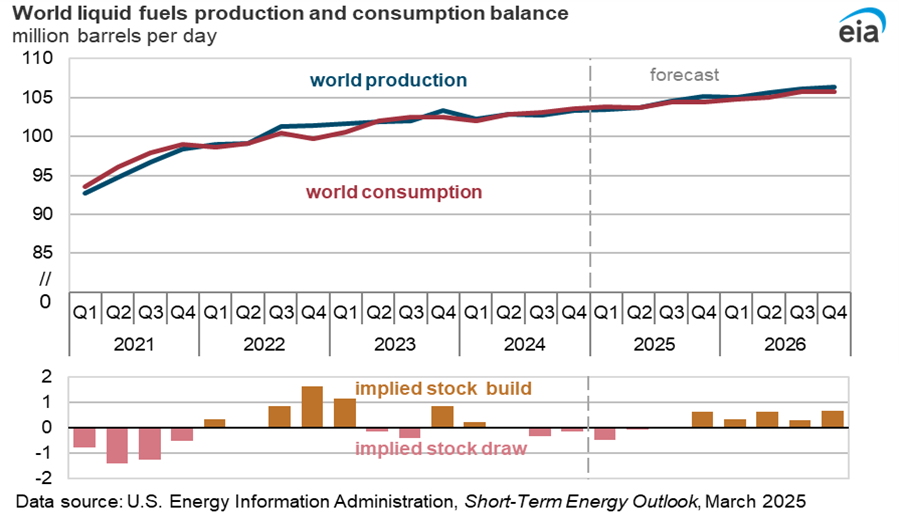
Brent oil prices are expected to fall due to oversupply in late 2025 and 2026.
I believe looking at C+C supply and demand is more useful that total liquids, particularly when considering the price of crude oil. The demand estimate by the EIA looks more reasonable in my view than the supply estimate. At a Brent price of $68/b in 2026, I would not expect a surge in C+C output.
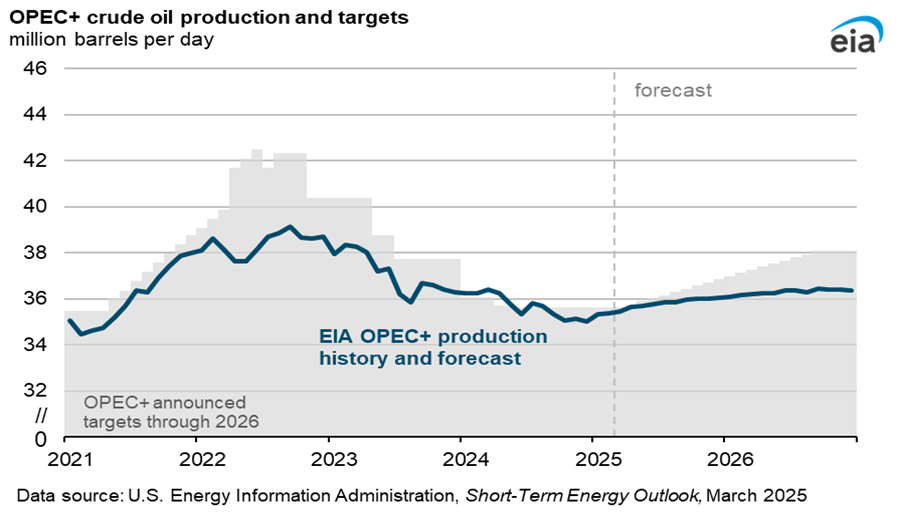
The Trump administration is trying to reduce oil exports from Iran and Venezuela which will tend to reduce OPEC+ crude output, low oil prices may also reduce the growth in OPEC+ output so more than 36 Mb/d seems unlikely if the oil price forecast proves correct.
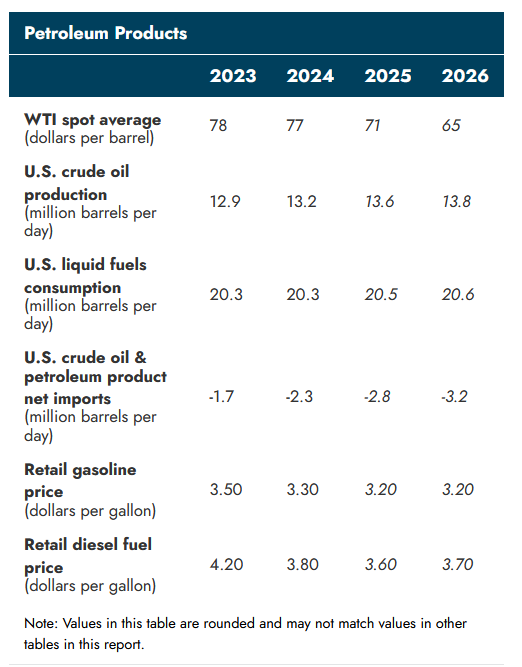
The forecast for WTI in 2026 is $3/b higher than last month’s report and output in 2026 is also higher by 100 kb/d compared to last month as a result. The other figures in this table are unchanged from last month’s report.
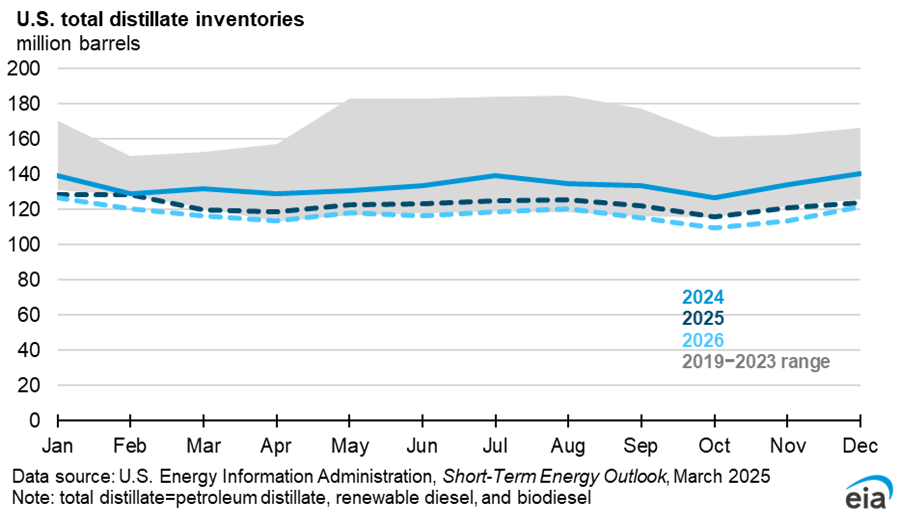
Distillate stocks are expected to fall to below the 2019-2023 range in 2026 due to refinery closures and higher demand.
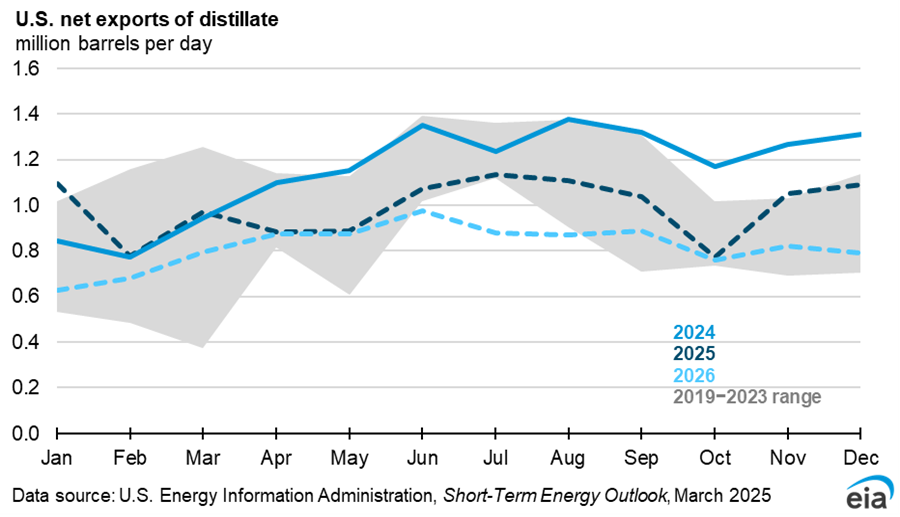
The lower stock levels of distillate fuel will lead to lower net exports in 2025 and 2026 compared to 2024.
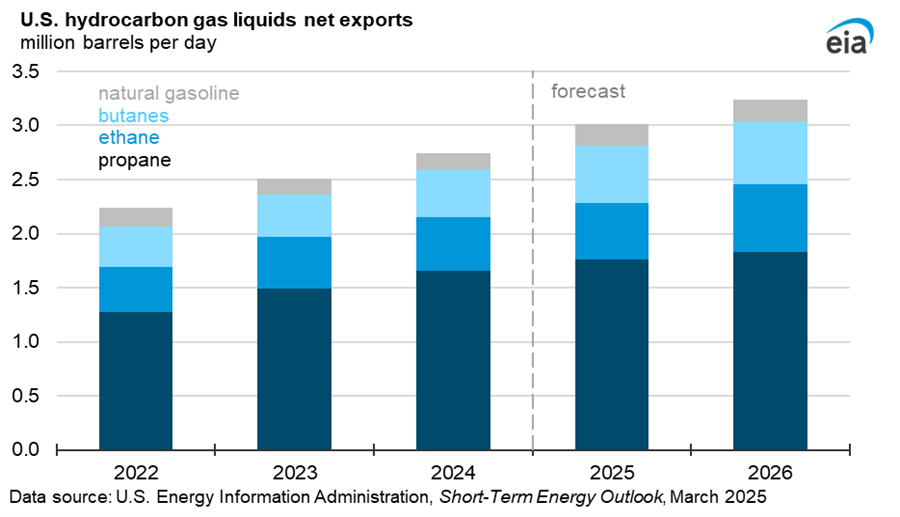
Net exports of HGL increase by 10% in 2025 and by 7% in 2026 as there is high demand for these products in the petrochemical industry. Domestic consumption is expected to be flat for these products while higher natural gas output leads to higher NGL output most of which will be exported.
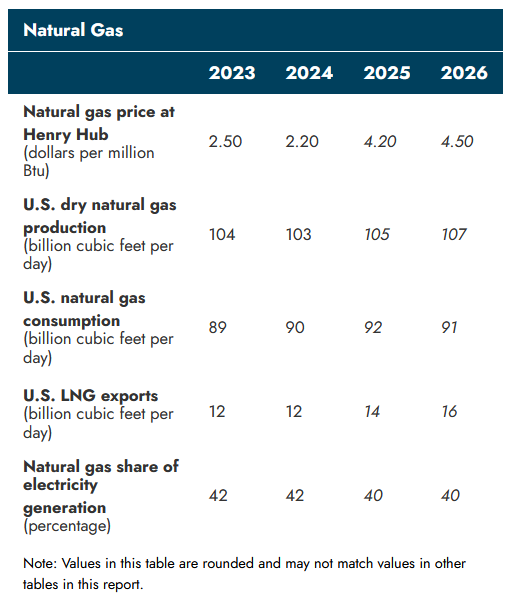
Last month the forecast for Natural gas price was $3.80 and $4.20 per MMBtu in 2025 and 2026, so a significant increase this month with 2025 at $4.20/MMBtu and 2026 at $4.50/MMBtu. Also the consumption of natural gas has been revised higher in 2025 and 2026 relative to last month’s forecast (91 and 90 BCF/d.)
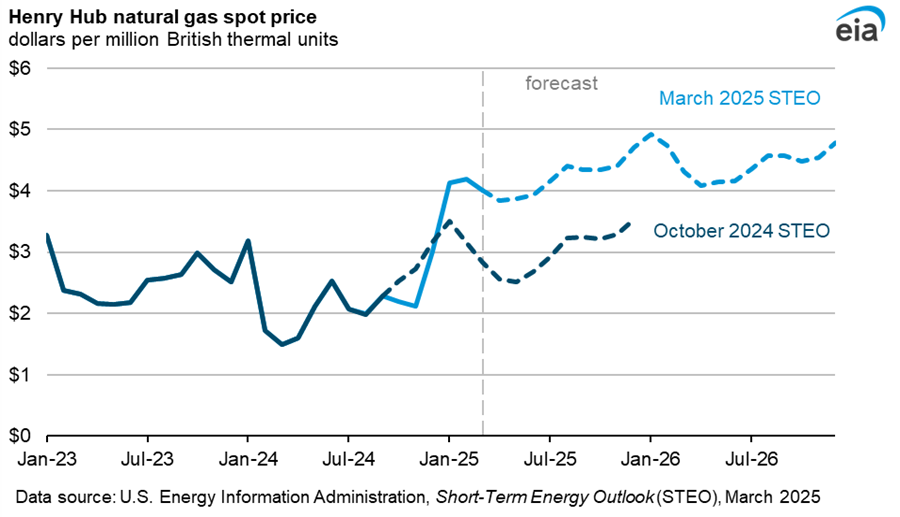
The chart above shows the significant change in the natural gas price forecast since last October. For the first two months of 2025 natural gas prices were $0.80/MMBtu higher than the October 2024 forecast.
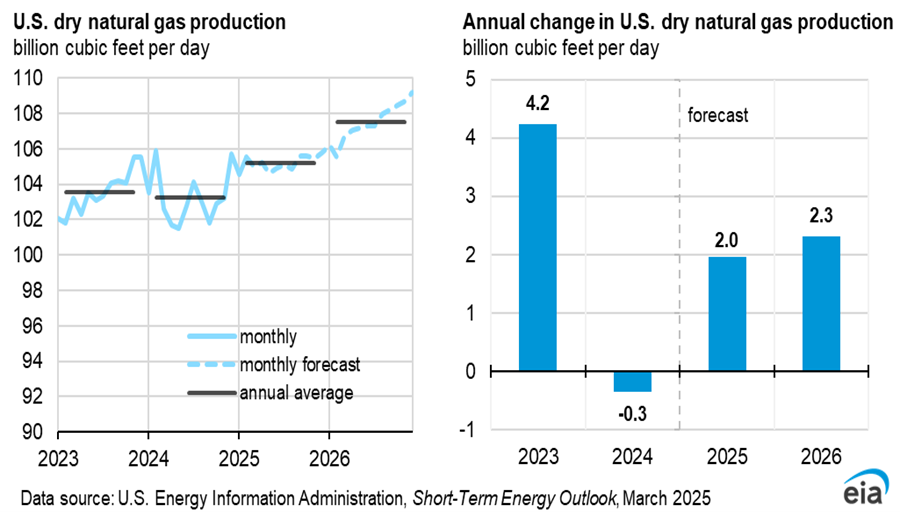
Natural gas output was 103 BCF/d in 2024 and rises by 2% in both 2025 and 2026.
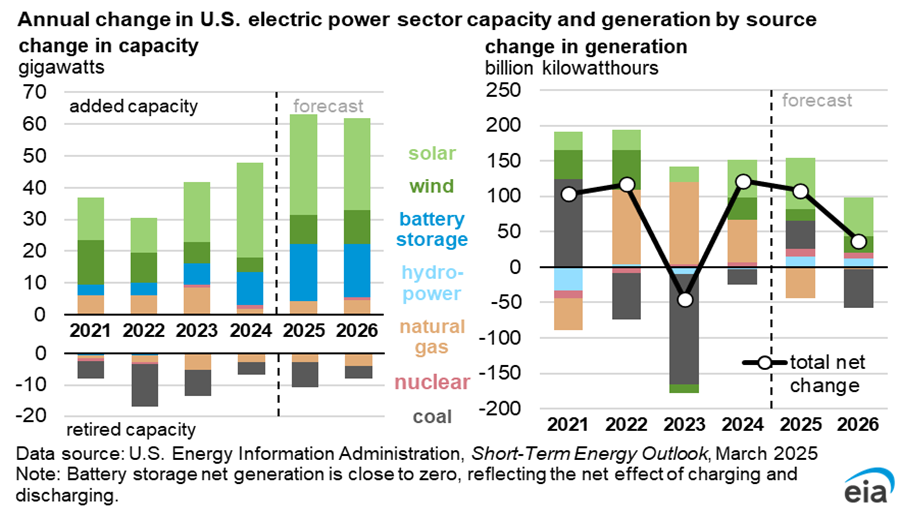
The right hand side of the chart above is more useful as comparisons of capacity are not straightforward between wind, solar and fossil fuel sources. Output from natural gas power plants falls in 2025 due to higher natural gas prices and coal output is expected to fall in 2026 due to a smaller increase in demand and expanding output from wind and solar.
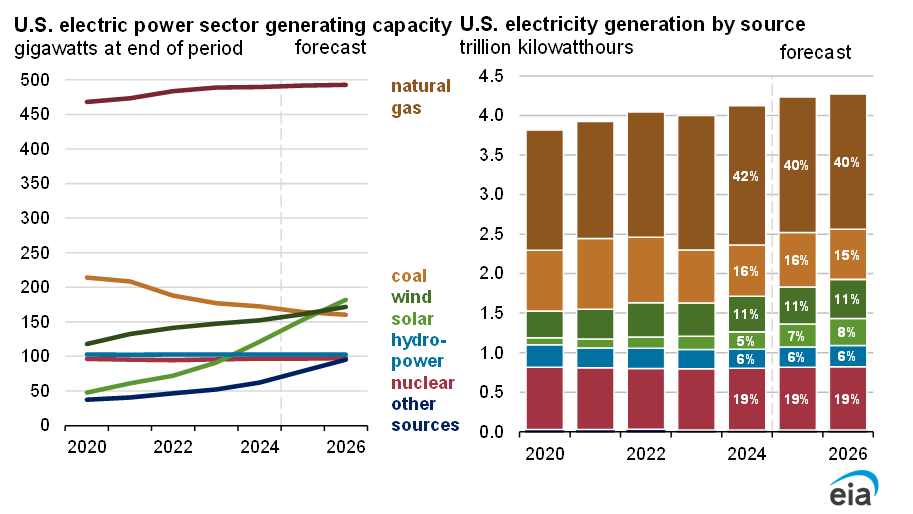
Again I focus on the right side of the chart above (generation of electric power) with wind and solar output expanding to 19% of total power output by 2026 and all non-fossil fuel power output (solar, wind, hydro, and nuclear) at 44% of total electric power output (up from 41% in 2024.)
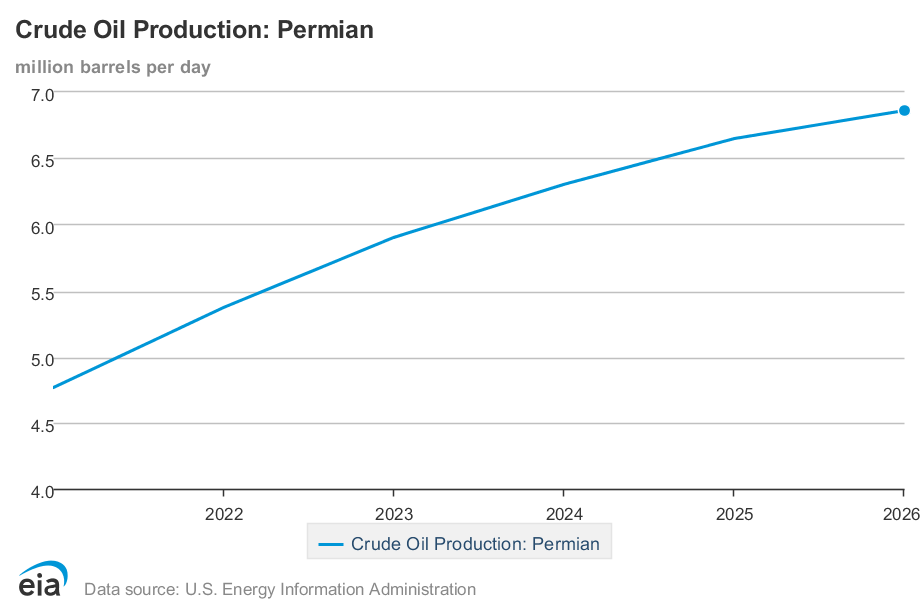
Permian region C+C output increases to 6.85 Mb/d in 2026 from 6.3 Mb/d in 2024 in the March 2025 STEO.
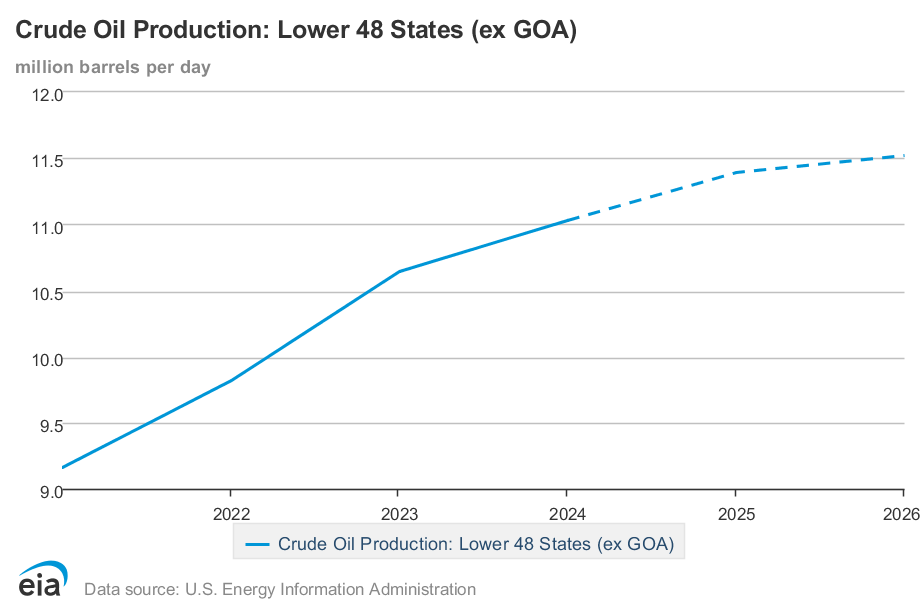
US L48 excluding GOM C+C output increases from 11.03 Mb/d in 2024 to 11.52 Mb/d in 2026. All of this increase comes from the Permian Basin.
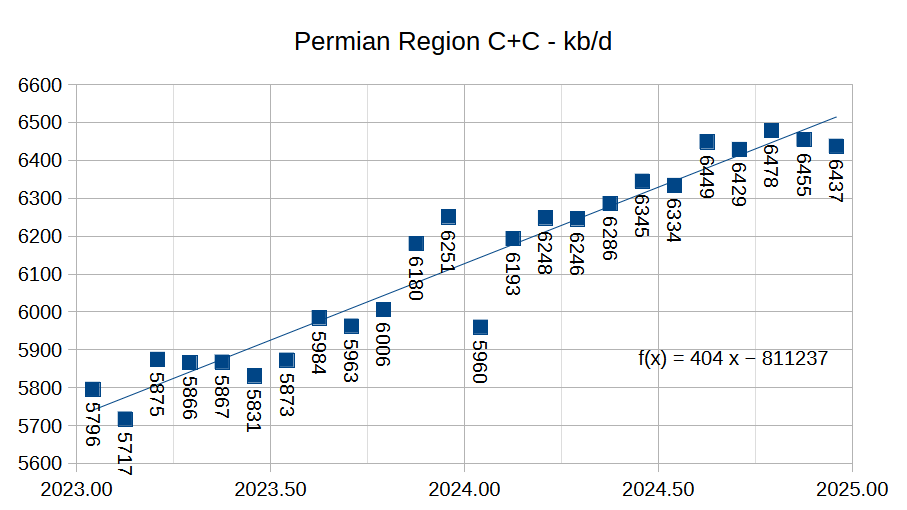
Estimate of Permian region output using latest TX RRC and NM OCD and EIA data. Output has been pretty flat from August 2024 to December 2024.
66 responses to “Short Term Energy Outlook, March 2025”
STEO projection for Permian Basin Region C plus C through Dec 2026, chart starts at December 2022 and reflects monthly data estimates and forecast. The OLS trend for Jan 2023 to Dec 2025 has the annual rate of increase at 382 kb/d, and for Jan 2026 to Dec 2026 the OLS trend has an annual rate of increase of about 58 kb/d, more than 6 times lower than the earlier 2023-2025 period.
https://www.msn.com/en-ca/money/economy/oil-set-to-rise-for-third-week-on-venezuela-iran-pressure/ar-AA1BQyk1
Oil set to rise on slowdown from Venezuela, Iranian pressure.
https://www.firstpost.com/world/rubio-warns-venezuela-of-force-if-it-attacks-oil-rich-guyana-as-us-tries-to-gain-an-edge-over-china-13875163.html
Rubio warns Venezuela not to attack Guyana.
https://www.business-standard.com/world-news/venezuela-increases-oil-exports-to-china-as-us-secondary-tariff-tightens-125032701435_1.html
Seriously, who could not have predicted that Trump cutting off Chevron in Venezuela and Tariffing anyone that imports Venezulan oil.
Would simply shift that oil to China!!!!
As far as Peak Oil is concerned, America being right next to Canada and Venezuela is extremely fortunate…
And Trump is trying to RUIN IT.
Andre the Giant,
Trump is not the sharpest tool in the shed, he probably is not aware how much oil we import from Canada and likely is not aware that much of the tight oil produced in the US is not well suited to the refinery capacity that exists in the US. Drill baby drill doesn’t help much if we cannot refine the oil that oil produced.
Trump is unlikely to know any of this.
I read another article with more detail regarding the Dallas Fed survey comments. Major frustrations with President Trump.
Glad I’m not as out of step with other oil producers as I had thought I was.
Maybe he needs to send oil producers checks like he does the farmers to keep them in line.
Next week US farmers will be be getting a big payday, between $29-42 per acre for 2024 corn, wheat and soybean acres, maximum of $125k, $250k if 75% or more of income is agriculture related.
There will be a lot of farmers who max out on this, as farms have gotten much bigger and much fewer in number.
And they complain about food stamps.
Great stuff from Mr.Shellman, especially see the comments
https://www.oilystuff.com/forumstuff/forum-stuff/green-chickens-on-u-s-natgas-abundance-lng-exports
Also this chart for appalachian has normalized well profiles, it would be interesting if there was a cumulative well profile, but it looks like the well profile may have peaked around 2020 when normalized for lateral length.
https://static.wixstatic.com/media/8cc98c_d447efcd77a148ffafe621d065709426~mv2.png/v1/fill/w_984,h_522,al_c,q_90,usm_0.66_1.00_0.01,enc_auto/8cc98c_d447efcd77a148ffafe621d065709426~mv2.png
The last Novilabs post that we can get data for all of the Appalachian is at link below
https://novilabs.com/blog/us-update-through-december-2021/
From this US post you can chose gas and select any of the basins covered, link below has appalachian gas wells
https://public.tableau.com/shared/N6NNCZ9P5?:toolbar=n&:display_count=n&:origin=viz_share_link&:embed=y
Always read the comments section as well with Mr. Shellman’s valuable posts. Great Info in both places..
I consider Mike, whether you agree with him politically or not, an American HERO.
Cause he is being honest and is obviously qualified,
and most others are bullshit to line their own pockets!
PS: My one disagreement with Mr. Shellman is his feelings toward Dennis.
Dennis is doing great work and being honest, he just disagrees with your view.
He aint trying to sell you a life insurance policy, just doing his analysis.
Not everyone can have their hand in the dirt!!
“BOE Report is Canada’s source for oil and gas news, activity and information. The publication launched in January 2013 and is the most read daily oil and gas news website in Canada, reaching over 100,000 energy professionals each month.”
https://boereport.com/2025/03/27/us-oil-producers-face-new-challenges-as-top-oilfield-flags/
“U.S. oil producers are grappling with geological limits to production growth as the country’s top oilfield ages and produces more water and gas and less oil – and may be nearing peak output.
The Permian basin was the centerpiece of the shale revolution that began nearly two decades ago and spurred the U.S. to become the world’s top oil producer, stealing market share from the Organization of the Petroleum Exporting Countries (OPEC) and other top producers.”
Older blog post May 2024, but new to me
“Permian Basin may soon face a peak oil output”
https://oilgasleads.com/permian-basin-may-soon-face-a-peak-oil-output/
Shellman’s angry illogical outburst just before the election about how he was going to vote for Trump because he (Shellman not Trump) had worked hard as a young man was a great illustration of the danger of social media.
You can’t make good decisions if you judgement is clouded by emotions. Social media is designed to keep users engaged by triggering their emotions. Anger is one of the easiest emotions to stir up.
The tech bros discovered this as a get rich quick scheme, but since then darker powers have recognized its usefulness. If you get triggered by something you read online or see on the TV, step back and take a deep breath. Chances are you are being manipulated.
Andre,
I agree the Mike Shellman does great stuff, I also agree with him that exporting US oil and natural gas is not a smart policy.
When the oil runs out the US will have had a large net oil debt with the rest of the world. A lot of that was pure waste thanks to incompetent transportation policy. The question is how the country will pay for it.
If the US can sell oil and gas overseas, it has a competitive advantage in this sector. It should use that to pay back some of its vast foreign debt, much of which was incurred by imprudent consumption of foreign oil. It really does not make sense for a country not to make use of its competitive advantages.
D C,
That normalized productivity stagnant in AB by Mike is not a simple normalized to lateral length, it also normalized to proppant loading.
The prop loading is nearly irrelevant to the gas in place or tier 123s in Marcellus AB, its cost could zero if following current trend of prop loading. i.e. from “ceramic gel” to “white sand slick water” to “local sand slick water” to “wet sand slick water”
The prop loading is the biggest myth/sham in shale revolution or fracking.
Initially, 50 years ago all textbook in petroleum engineering will tell you prop is the central pillar of fracking. Fluid is the collateral damage to the well when you have to use fluid to carry prop to the fractures. But, from day one of shale revolution, the fracking pioneers like Mayohofer had been preaching SRV, or volumetric stimulation where prop loading is no longer the central pillar. This is also what Mayohofer has been preaching in Wright’s Pinnacle. But the fracking neocons or deep state has been so strong that still the majority does not bite SRV. The AI studies like NOVI and others keep on pressing prop loading and confuse it with fluid, which are de facto brothers.
see my unconventional story here,
https://www.linkedin.com/pulse/shale-revolution-arent-when-you-judge-conventional-wisdom-sheng-wu
The mainstream like Ted now in SAU and Art believe gas and oil are the same, but they are not. The gas almost don’t have the PVT bubble point death problem, lifting cost usually much lower, and recovery usually 2X or higher than oil. In AB, Marcellus recovery easily top 50% even with 600ft spacing. In WV, and SWPA, many have recovery over 100%.
In terms oil, many knows bubble point death, but still majority believe viscosity is more important. That’s why few could believe heavier and more viscous shale oil from Uinta to Vaca Muerta could outproduce Permian.
Sheng Wu,
Not correct. It is normalized only for lateral length, perhaps prop loading doesn’t matter, I am not a petroleum engineer and there may be different opinions on this, I don’t have access to data to do my own analysis. Your claim that proppant loading does not matter may or may not be correct. In any case the point is the new well productivity may be decreasing rather than increasing as they run out of room in the productive areas of the Marcellus and Utica plays which are much smaller than the entire play, maybe a third of the entire area of the plays.
D C,
The normalized plot for Marcellus productivity by Mike probably is only normalized for lateral length, and Mike inadvaently added “prop load”.
But, this is bad-apple picking as we all know in 2020-21 the Covid effect is there, the sharp fell off is probably a result of choke back.
Last month, I digged out a latest plot by a energy consultant but now I can not find the link. See attached, and obviously things continue to improve after 2021. Note, this is probably not normalized to lateral length. Note
1. the choke-back in 2021 for 2021 wells as well as other wells in 2024.
2. the production profile difference here for Marcellus is different to Permian oil or Haynesville gas — the tail overall level for new wells also gets significantly higher than legacy wells.
Here what I observed/guessed major shale gas and oil basin IP/EUR per foot here,
1. Permian oil, IP stay the same or slightly up, EUR dropped 5~10% in past 3 years — similar to D C your plot last month, but this is almost 10% drop in 2022, and probably another 3~5% in 2023, and another 3~5% in 2024!!! much larger than the 2% drop D C put in your projection.
2. Haynesville gas, IP same or slightly up, EUR dropped 2~5%/year in past years, this drop does not include the new monster wells in East Haynesville, which probably will lift the IP and EUR per foot significantly
3. Marcellus gas, IP up slightly, and EUR up slightly. However, if zoom into the NEPA dry gas, the IP and EUR probably went up obviously by 3~5% each year. While, in SWPA and WV, the IP and EUR also went up obviously by 3~5%, but the starting numbers for SWPA and WV are much lower than the NEPA, so this dragged down the overall Marcellus. Operators would rather drill more in SWPA&WV because the abundant wet gas liquid there, and the shallower depth there makes the economics; while in the NEPA, dry gas price is probably even lower than SWPA, and they just focus on the limited tier 1 or 2 acreage and improve the frac loading etc.
Sheng Wu,
I think the cumulative well profiles are more interesting. Looking at your chart (Marcellus, I think) it does not look like there has been significant changes in the well profile since 2020, and note that the 2024 well profile likely has a number of wells with little data (those completed in December 2024. might have two months of data at most) so I would discount the accuracy of the 2024 well profile on the chart or simply ignore it.
I do not see the improvement you speak of since 2021 and if we normalize for lateral length we would likely see a decrease in productivity per lateral foot.
D C,
The per foot productivity probably decrease a little, but this is because what I pointed above:
1. more production are in SWPA and WV wet gas, where the initial gas IP and EUR is obviously lower than than NEPA dry gas. This will drag down the productivity.
2. wet gas in SWPA and WV are also much shallower, and they could drill 5mile in 3 days and complete much faster and cheaper than rest. The wet gas NGL liquid will compensate for the low dry gas.
3. The dry gas productivity per foot probably increased a little too, but still dragged down by the wet gas wells.
Sheng Wu,
Chart is here
https://thundersaidenergy.com/downloads/marcellus-shale-well-by-well-production-database/
The well profiles are not normalized and I would discount the 2024 well profile as there is not enough data at this point that is reliable for 2024 vintage wells. From 2019 to 2023 there looks to be very little change in EUR when the wells are not normalized. If we normalize for lateral length EUR per 1000 feet has likely decreased.
here is the plot of gross shale gas withdraw and production from LA (Haynesville), PA (Marcellus, NEPA) and WV (Marcellus, wet gas).
following are observed for the production behavior of these 3 basins/states,
LA already had 2 peaks and 1 dip, it is not due to 50% of URR reached, in fact, nobody had an idea of URR was in 2015, and it was dipped by lower gas price, and the poor EUR fast decline after initial ectasy in highest IP. The bounce back is mainly due operators could double the IP and EUR. The 2nd peak is not due to 50% of URR reached, still nobody know the URR, espeically with the discovery of East Haynesville in TX.
PA fast increase while LA dipped first time is a reflection of lower cost of PA Marcellus shale than LA Haynesville.
Chart with annual data shale gas data through 2023, also includes Ohio as well as PA, WV, and LA.
Sheng Wu,
Great paper by Saputra et al, 2024 at link below.
https://pubs.geoscienceworld.org/aapg/aapgbull/article/108/1/15/631779/Forecast-of-economic-gas-production-in-the
D C,
Yes, I commented on this paper before — their data sets (Tier1) are way off lower than actual, i.e. NOVI 2022 NEPA or SWPA cores.
One extra note here, the Permian well GOR spike does not mean it will become a prolific gas producer, as the gas production also got hammered, just not as badly as oil. Saputra and team Padzek had a paper about Permian become a gas province larger than Marcellus. It is not that easy, particularly when oil really drops, no operator will stay on for the remaining gas. Again, the liquid rich gas in shallow WV sometimes could produce more liquid per lateral than the 3~>4km deep Permain and EF, and 2~3 times more gas.
Another note about the water increase in Permain and other shale basins, the news reporter just put a huge water ratio with oil/liquid for Marcellus. This is unfair because the liquid is relatively small in Marcellus, and the water to gas BOE ratio is real smaller compared to other shale basins.
Sheng wu,
see chart below with 2017-2020 Marcellus wells from northeast core. Cumulative at 60 months is 8.7 BCF, similar to Saputra estimate. Also note that the increase in productivity after 2020 in the Marcellus is mostly a function of longer laterals, longer laterals reduce the potential number of new wells as the productive area is relatively fixed, so overall URR is unchanged.
If lateral length increases by a factor of 2, the potential number of new wells that can be drilled is reduced by a factor of 2.
The issue with the Marcellus is a small area with productive potential, rather than water. I imagine you are aware that water disposal is a serious problem in the Permian. Perhaps water is not a problem in the Marcellus, though there is no doubt a lot of water from fracking and that water does need to be dealt with.
The Saputra paper on the Permian (2021) focused on the tight oil rather than gas, in the Permian gas is just a byproduct of tight oil output and when the tight oil wells are no longer profitable, the drilling stops and the gas output stops as the wells are shut in due to lack of profitablity. Nobody is drilling in the Permian looking for natural gas (or very few), certainly not at Waha spot prices of under $2/MCF.
https://www.mdpi.com/1996-1073/15/1/43
My guess is that for the Permian only about half of the non-core wells identified in the Saputra et al paper will be completed and gas URR will be roughly 198 TCF with tight oil URR around 40 Gb.
D C,
I agree I might discounted longer lateral for 2020 (my mistake above put in 2022) NEPA core, but it is hard to imagine the IP12mon or IP18mon had almost 33% jump to 2019 all due to 33% increase in lateral length. While from 2018-2019, the increase in IP12m is much smaller. Note that NEPA has Marcellus much deeper at 10,000ft TVD, and increase the lateral length by 33% is not that easy. Then there is a challenge to ask why 2023 is not continuously ~10~20% better if we assume the lateral increase is a stable upward trend. Also, in 2019-2017 improvements were small, and 2016-2014 were also slowly improving. Something other than lateral length increase should contribute to this grouping effect.
Sseems it is back to live, https://novilabs.com/blog/pennsylvania-update-through-march-2023/, and I wrote this Linkedin post, see link below,
https://www.linkedin.com/pulse/comparing-vaca-muerta-shale-oil-gas-best-us-patches-production-wu-tw42c
The NEPA core after 2020 is much better than 8.5BCF @ 3~4 years, even the whole PA Marcellus 2020 has made over 8BCF in 3 years (choose Marcellus formation only improves further) that’s why I was quite amazed the low numbers used by Saputra paper. I was assuming the paper was submitted in 2023, and should have some latest numbers, but in fact it was submitted May, 2021, and took 2.5 years to update (?) and publish. This kind of estimate modeling should be published timely, otherwise it is confusing.
One note about predicted production scenarios after 2020 (Fig.17), none is close to actual after 2020. With WV increasing the past 5 years, and PA holds steady barely declining.
Actually, this resembles their predictions of other shale gas basins, and overall shale gas from US — all off in an unbelievable fashion.
Looking back, what really happens in Marcellus, the one predicted most close is probably Professor Engeld at URR of ~500 TCF.
Their Permian paper in 2021 also has the forecast scenarios quite off, although at least it predicts increase from 2021.
Sheng wu,
Prediction future output depends on future productivity changes and future well completions, these are always unknown. The wells they have modelled are for specific areas and specific times. When we look at 2017-2020 Northeast core and 2017-2020 Southwest Core wells from Novi Labs the Saputra estimates match the Novi Lab data very closely.
Future is never known. Below is a scenario that assumes a slight increase in completion rate due to higher natural gas prices with completion rate decreasing after 2031, this scenario is likely too optimistic in my view.
Sheng Wu, also pulled SW core data together for 2017-2020 Marcellus wells from OH, WV. and PA from
https://novilabs.com/blog/us-update-through-december-2021/
Again at 60 months about 6.5 BCF cumulative and 6 BCF at 48 months, similar to Saputra estimate.
NOVI data link is back here,
https://novilabs.com/blog/pennsylvania-update-through-march-2023/
For the Marcellus SW core, OH should not be included unless you choose Formation Marcellus only, and, most operators here depend on the liquid, NGL or condensate, to make things even or keep on drilling, not just on gas. So, the gas in SW Marcellous is really low, particularly when compared to NEPA dry gas core. This could enable 2nd tier (Saputra’s 80 Million Scf) area to be drilled without considering gas price. Again, this will bring down the Marcellus average gas productivity; and also make the lateral length looks longer for the whole Marcellus. So, this could defeat the gas only selection (80 Million SCF) in Saputra paper.
If one really want to compare Saputra paper SW Marcellus core, probably best is to compare the SWPA core (Washington, Westmore, Greene and Allegeny) only where the wet gas are mainly still gas, and yet super productive, giving the fact that the formation thickness is way thinner and shallower than NEPA, and still has some NGL. In 2020, they could also do 8.5BCF at 36 mon accum, so does 2021.
I choose 3 counties, Wyomin, Susqueshana, and Bradford, as NEPA dry gas core,
2017: 60mon accum, all wells @8.7BCF
2018 & 2019: both should be better than 2017 , easily 9BCF @ 60mon accum?
2020: 30mon accum, most wells @ 8.6BCF, expect 60mon accum to 11.5BCF?
2021: slightly worse than 2020
2022: slightly worse than 2021, but still obviously better than 2019
So, if one might want to group by performance, 2020 should not be grouped with 2017-2020, but rather 2020-2024.
2nd group: 2017-2019
3rd group: 2014-2016
One note about the NEPA dry gas core — the 2nd tier locations are actually upper Marcellus, just above the current lower Marcellus. The productivity is about 10~25% lower only in previous pilot test. This is not mentioned in Saputra paper.
Sheng Wu,
I chose Marcellus formation only (see chart posted). I chose 6 counties for NW core and 4 counties in PA for SW Core plus WV Marcellus counties and only one county in Ohio for Southwest Core. Nobody is drilling these wells just for NGL and the fact is that output has not been increasing much in the Appalachian Basin of late, maybe this changes with higher natural gas prices, NGL prices tend to be linked to oil prices which have been pretty low lately so NGL output doesn’t help profits very much due to low prices.
Marketed natural gas for PA, WV, OH, centered 12 month average (CTMA) mostly Marcellus and Utica formation shale gas from 2010 to 2024. Peak CTMA in September 2023 shown on chart. Not clear if higher natural gas prices will raise output much, the future will answer this question.
Rig Report for the Week Ending March 28
– US Hz oil rigs decreased by 4 to 445. The count is also down 14 rigs from April 19, 2024 and is up 18 relative to its recent lowest count of 427 on July 24th. The rig count has broken out of the very tight range between 427 and 442 since July and hit a recent high of 449 last week. Is this week’s drop of 4 rigs linked to the drop in WTI from $80/b in Mid January to $69/b today?
– The New Mexico count dropped by 1 to 92 while the Texas Permian rigs dropped by 4 to 190 for a total Permian drop of 5 rigs.
– In New Mexico Lea was unchanged at 47 while Eddy dropped 1 to 45.
– In Texas, Midland added 1 to 28 and Martin dropped 2 to 26.
– Eagle Ford was unchanged at 42.
– Ohio’s rig count increased by 1 to 3.
– NG Hz rigs added 1 to 82 and have been at 81 ± 1 for the last 9 weeks.
The Frac report will be posted when the data is published.
Frac Spread Report for the Week Ending March 28
The frac spread count dropped by 6 to 210. It is also down 51 from one year ago and down by 31 spreads since October 11. Note where the Frac spread count was a little over a year ago, March 8, 272. Quite a dramatic drop.
The question that arises from looking at this morning numbers is whether the drop of 6 Frac spreads is the beginning of another round of weekly drops or whether 210 frac spreads may be the new equilibrium balance between fracs and rigs.
North Dakota Oil Production dropped by 19 kb/d in January
Recent Permian tight oil estimate for 2024 has annual output at 5863 kb/d, the Permian tight oil scenario below is based on recent rig counts in the Permian Basin and historical rig count to completion rates. Permian URR is at about 43 Gb with a 2027 peak at annual average output of 6211 kb/d, with an annual average increase in output of 206 kb/d in 2025, 126 kb/d in 2026, and 16 kb/d in 2027. The URR is about 57% of the USGS mean TRR of 75 Gb for the Permian Basin.
Cumulative output to Feb 2025 is about 14.7 Gb and wells completed at about 53k, if no wells were competed after Feb 2025 the URR would be about 21 Gb.
Comparison of DC Scenario for Permian tight oil vs STEO (Annual average output in kb/d). Note that my estimate for recent Permian tight oil output in December 2024 is roughly 6000 kb/d, so roughly flat output in 2025 from the end of 2024 level of Permian output and only about a 200 kb/d increase over the next two years (from December 2024 to December 2026) for Permian tight oil output.
So the people of the US can go on pretending everything is just fine for about 7 more years.
Hickory,
Permian output declining in 2028 (we would only know about this in March 2029 for annual average output) could change things as far as the Saudi America meme. US C plus C output would probably peak about a year earlier (in 2027, which we would only be able to confirm in March 2028) so that is about 3 years in the future, natural gas will probably peak about 3 to 5 years after crude plus condensate in the US (2030 to 2032) at about 120 BCF/d.
With the rough plateau lasting into the early the early 2030’s.
I think a smart country would have plans ready to phase in which would divert available petrol to critical use via some form of financial penalty for less important/optional uses….better than going straight into rationing.
Although I assume it will piss people off mightily if the wealthy are exempt from restrictions on use in a setting of shortage.
Hickory,
I doubt there will be shortages, more likely simply higher oil prices, which would accelerate the transition to alternatives to oil. Europe and Asia are much better positioned in this regard, eventually North American nations may follow their lead.
Once the supply starts to drop significantly in the next decade there will be
Shortages for billions who can’t afford higher pricing for basic operations,
and shortages for those regions who get boxed out for geopolitical reasons.
Hickory,
I think it more likely that oil output falls due to low oil prices and lack of demand. Kind of like film for cameras or buggy whips.
If global economic growth is slow over the next 7 years there will be 2 opposing effects on this race to adapt
-oil product demand remains little changed from current levels
-the prosperity required for electrification is less robust as compared to a more rapid growth scenario
Something like 80 million more people reached adulthood (potential consumers) last year. Each person uses oil products in many ways. Global ocean freight volume, airline miles, use of petrol in agric/food handling, and petrochemical industries are all still on an uptrend and have poor prospects for oil product replacement.
The behavior of Russia on Ukraine, of Houthis, of the US (in regard to trump policies on trade war and threat to annex places like Greenland, Canada and Panama, and sanctions on Iran and Venezuela) are likely just a prelude of the disruption to the international trade that escalates. This does not bode well for international production of steel (pipe) and oil, as the post-peak era approaches.
Article on Permian
https://www.reuters.com/markets/commodities/us-oil-producers-face-new-challenges-top-oilfield-flags-2025-03-27/
Water is a serious problem in the Permian relative to other Basins. The high water cut raises costs, also the basin is becoming gassier over time and the gas does not create much revenue compared to oil.
“The higher produced water ratio will ultimately drive costs for oil producers higher, according to Shannon Flowers, director of crude and water marketing at Coterra Energy.
Higher costs to dispose of, reuse, or recycle produced water isn’t good news for U.S. oil producers who are already concerned with the U.S. Administration’s preference of a $50 a barrel oil price.”
“There cannot be “U.S. energy dominance” and $50 per barrel oil; those two statements are contradictory. At $50-per-barrel oil, we will see U.S. oil production start to decline immediately and likely significantly (1 million barrels per day plus within a couple quarters),” an executive at an exploration and production firm wrote in comments to the Dallas Fed Energy Survey for the first quarter of 2025.”
““The U.S. oil cost curve is in a different place than it was five years ago; $70 per barrel is the new $50 per barrel,” the executive noted.”
US January Oi Production drops by 305 kb/d
Big drops in Texas and New Mexico. What is not clear here is whether this is a real drop associated with geology or whether it is related to the very low frac spread count in January. See Frac spread chart above.
More detailed US update and county updates on Thursday.
This could also be the typical winter drop in output which has occurred every winter since Dec 2020. Perhaps weather related, at least in part.
Weather, yes, but also a transition sputter by a major operator in the basin, Marathon.
Marathon was supposed to spud in some wells in T145N, R93W–8 of them–summer last year, but then was acquired by Conoco-Phillips and that acquisition somehow caused the pause of those wells. They’re just now going in.
The near stoppage by a major operator will show up in a small basin like the Bakken.
It’s almost certainly weather related. Consider that if you annualized a 305 bopd drop, it equates to 3.66 MM bopd. I really doubt “geology” would drive that sort of change so quickly. Consider that “using up sweet spot” is a gradual process.
More interesting to me is that this number, and the months prior, aren’t a whole lot higher than the monthly numbers going into the pandemic in late 2019, early 2020.
The pandemic threw a big wrench in things, but it sure took a long time to top those last few months prior to March, 2020, and so far those numbers haven’t been surpassed by much.
We were growing by about 1 million BOPD per year until the pandemic hit. Admittedly, the 2014 crash led to production losses in 2015-16. But prices weren’t exactly great in 2017-19 when shale producers really ramped up again.
Shallow sand,
I remember many claiming that US output would never return to the peak level of November 2019. I have always focused on 12 month average output. In 2019 US annual average output was 12314 kb/d and in 2024 it was 13209 kb/d, I agree growth lately has been slow, only 280 kb/d in 2024, but 2021 to 2023 was pretty strong growth at an annual rate of about 800 kb/d. This was nothing like the 2017 to 2019 growth of roughly 1450 kb/d per year, but similar to the average annual rate of growth from 2011 to 2019 which was about 830 kb/d. The peak in US C plus C output is very near, probably 2027 plus or minus 1 year.
Dennis
Maybe a bit of both
Ovi,
I think the drop is probably winter, but we will know better in June or July. From a geological and economic perspective, I would expect the trend will be a very slight rise in Permian output through the end of 2026 (an annual increase of about 100 kb/d on average from Dec 2024 to Dec 2026.) Then I expect decline in Permian output, starting in April 2027 after a short plateau from Jan to March 2027.
Dennis/Nony
Look at the underlying Texas and NM data. Texas production peaked in October. The EIA revised down November and December production. While weather may have played a role in January it is not the whole story. Also check NM. Drill Baby Drill does not appear to be likely.
Ovi,
I have done that and also looked at historical data, there have always been flat spots in historical output, Note that the increase I expect is significantly lower than the STEO forecast, only 100 kb/d annual increase over the next two years, compared with a 400 kb/d annual increase over the previous two years. Perhaps it will be zero, we will see.
U.S. Oil Output Drops to Lowest Level in 15 Months
January U.S. crude oil production was down 305,000 barrels per day, hitting 13.15 million bpd, a level it hasn’t dipped down to in over a year, according to data released by the U.S. Energy Information Administration (EIA) on Monday, also revising its December estimate downward by around 40,000 barrels, to 13.45 million bpd.
The top producer, Texas, saw a decline of 105,000 bpd, sitting at 5.58 billion bpd and its largest decline in 15 months, while the country’s number two producer, New Mexico, saw output fall by 53,000 bpd to 2.06 million bpd–also its lowest level in seven months.
U.S. production of natural gas also fell 1.7% in January.
Despite the downward trajectory, earlier this month, the EIA reported that the U.S. set a record for crude oil production in 2023, averaging 12.9 million barrels per day (b/d), surpassing the previous global and U.S. record of 12.3 million b/d set in 2019. No other countries breached the 13 million b/d capacity, and the Saudis recently withdrew their plans to boost production to 13 million b/d by 2027.
In 2023, the U.S., Russia, and Saudi Arabia together accounted for 40% of global oil production, totaling 32.8 million b/d, according to the EIA.
Again this could be weather related.
Note the typo in the Oil Price article, US set a new record in 2024 , surpassing the 2023 record, the current annual record is 13209 kb/d in 2024 and most recent trailing 12 month average (Feb 2024 to Jan 2025) is 13259 kb/d.
Chart below has centered 12 month average from July 1966 to August 2024.
Yes seems very likely that weather is a factor as every year since 2020 there has been a dip in US C plus C output in the winter.
Dennis.
Do you happen to know if any of the EIA data for the states is sales data as opposed to production data?
For example, I am pretty sure my small producing state is sales data, as it doesn’t collect production data from operators like Texas does.
If there are any significant states that just report sales data, this could be a partial explanation? Public companies may clean out the tanks in December to help on quarter end and year end production numbers?
Just guessing.
Shallow sand,
For some of the smaller producing states where there is no 914 Survey, the EIA just uses the data from the States and may just be estimating based on historical lags in the data. Only 15 states have operators fill out the 914 Survey (AR, CA, CO, KS, LA, MT,ND, NM, OH, OK, PA, TX, UT, WV, and WY) the other states the EIA uses a combination of State data and Enverus Data. In some cases there is no State or Enverus data, they may just assume in those cases that production is unchanged from the latest reported data. It is not clear whether the data is production or sales data, it may vary depending on the data that is available.
Just read some information from the EIA, the “other states” that are not estimated based on the 914 survey uses sales data from the EIA-182 report (Domestic crude first purchase report) Enverus data (for states covered by Enverus) and State data where available.
Information from
https://www.eia.gov/petroleum/production/pdf/eia914methodology.pdf
Another sales guess, but probably less important.
We have some very small leases that we shut in over the winter. We make sure and sell the oil in the tanks in December, when we shut them in. No reason to hold it over the winter.
For example, we have one well lease that just makes about 200 BO in a year. We shut it down in December. The oil purchaser hauled about 40 BO off it in December, which is a partial tank, as a favor to us so we don’t have to hold that oil for months over winter while shut in.
Dennis I’ve been thinking who’s to say we couldn’t have a second peak oil moment after the current shale plays peak.
It’s not unheard of for oil producers to experience regrowth in production and a second peak after new technology is introduced with Russia and Illinois being two examples. Right now American shale plays seems to be slowing down at our current rate of recovery of 5 to 10 percent.
So am thinking what would stop a scenario like this from happening.? We peak decline for a bit and eventually has oil prices start to rise. Firms invest more in EOR technology. Leading to a second peak sometime in the future
JP,
Not impossible, but I expect demand may start to decline leading to lower prices and less oil recovered. I may well be wrong and in that case your scenario is possible, I expect decline will be difficult to stop due to resource depletion, so I suspect the odds are low under 1 in 3.
An updated January US Oil Production report has been posted.
https://peakoilbarrel.com/januarys-us-oil-production-drops-big/
A new Open Thread Non-Petroleum has been posted.
https://peakoilbarrel.com/open-thread-non-petroleum-april-3-2025/
The outlook for the 2025 average Brent-price, $74 per barrel, looks very optimistic today.
Currently it’s trading at $63 per barrel.
We will need a lot of cheap cash in the coming months to get the price back up to $74…. or a sudden drop in the supply. Which would be great for the climate BTW.
Hans,
If oil prices drop below $60/b for WTI, we will see a drop in US oil supply, also Brent at under $65/b may lead to a cut from OPEC plus. I agree it might be good for climate, though a World Depression might slow the transition to non-fossil fuel energy.