Comments not related to oil or natural gas production in this thread please.
March Non-OPEC Production Slides
A post by Ovi at peakoilbarrel
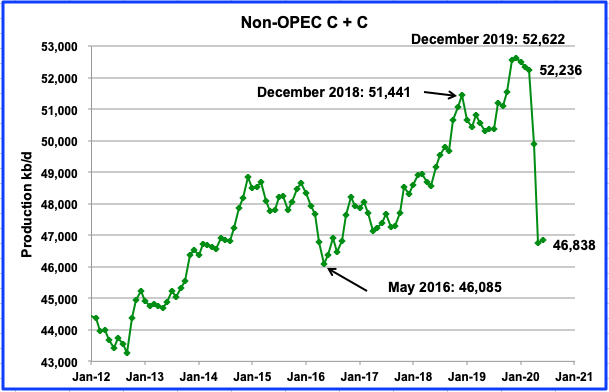
Below are a number of oil (C + C ) production charts for Non-OPEC countries created from data provided by the EIA’s International Energy Statistics and updated to March 2020. Information from other sources such as the OPEC and country specific sites is used to provide a short term outlook for future output and direction.
Near the end, there is a section comparing World oil production with World oil production W/O the US. Interestingly, World oil W/O the US peaked two years before World oil production. The last section provides a short summary of The Shift Report, where it shows the increasing difficulty oil producing countries will have in offsetting decline in old oil fields and the difficulty in getting back to pre-pandemic supply levels.
It would be appreciated if we could have some further comments on these two sections before the Covid comments start. Does the fact that world oil production W/O the US peaked two years before World oil production make it more likely that November 2018 will continue to be the date for Peak Oil? Are there any weaknesses or missing or newer information that could shift the Shift Report time frame for meeting world demand post 2025?
Open Thread Non-Petroleum, July 21, 2020
Comments not related to oil or natural gas production in this thread, please. This includes commentary on the pandemic. Thanks.
OPEC June 2020 Production Data
All OPEC data below is from the July 2020 OPEC Monthly Oil Market Report.
All OPEC data is through June 2020 and is in thousand barrels per day. All copied and pasted texts are in italics.
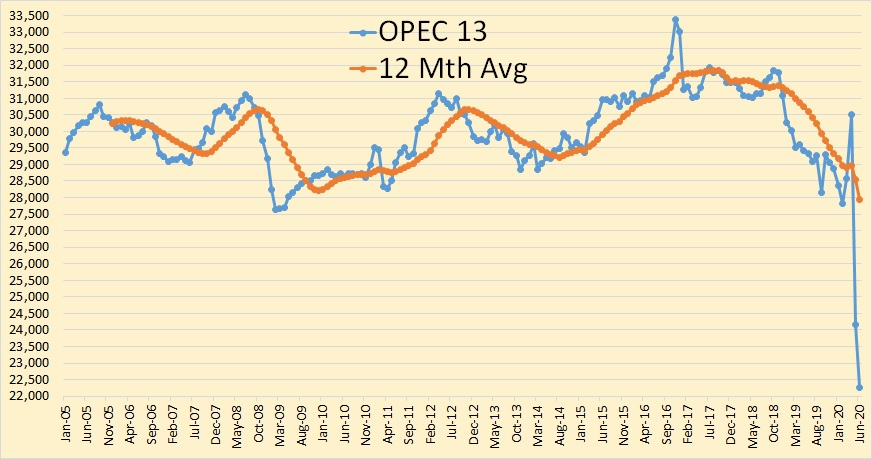
OPEC cut further in June, down almost 1.2 million barrels per day. They are down about 6.8 million barrels per day since November 2019.
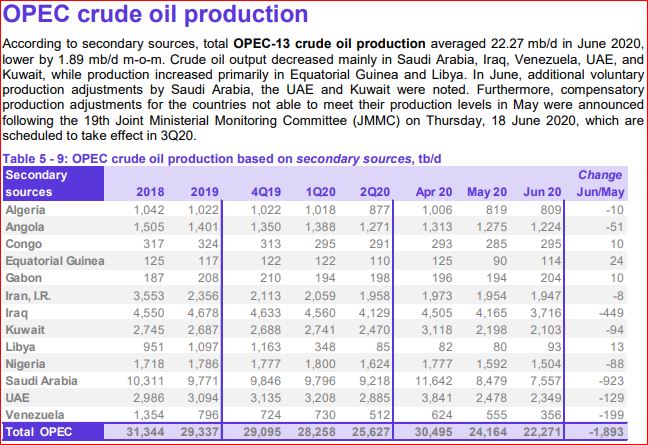
All OPEC major producers cut production in June. The tiny producers didn’t seem to bother.
Read MoreEIA’s Electric Power Monthly – June 2020 Edition with data for April
A Guest Post by Islandboy
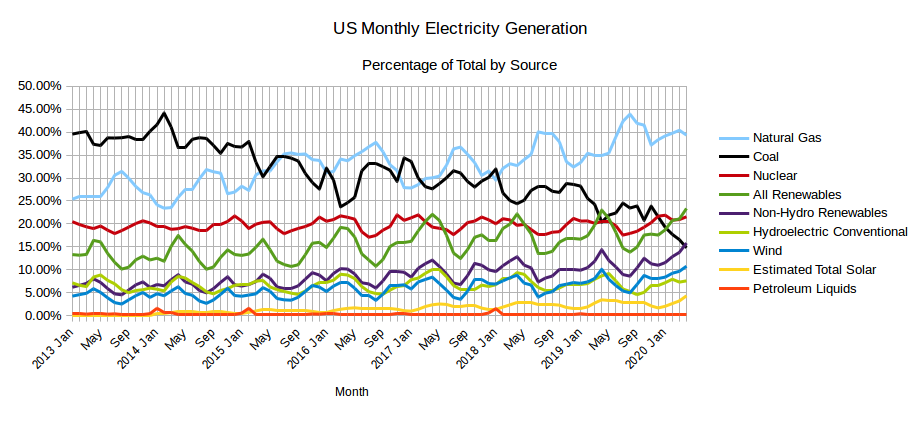
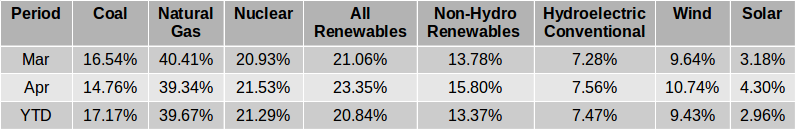
The EIA released the latest edition of their Electric Power Monthly on June 24th, with data for April 2020. The table above shows the percentage contribution of the main fuel sources to two decimal places for the last two months and the year 2020 to date. Read More