Comments not related to oil or natural gas production in this thread please. Thanks.
Read MoreSeptember Non-OPEC and World Oil Production Drops
By Ovi
The focus of this post is an overview of World oil production along with a more detailed review of the top 11 Non-OPEC oil producing countries. OPEC production is covered in a separate post.
Below are a number of Crude plus Condensate (C + C) production charts, usually shortened to “oil”, for oil producing countries. The charts are created from data provided by the EIA’s International Energy Statistics and are updated to September 2024. This is the latest and most detailed/complete World oil production information available. Information from other sources such as OPEC, the STEO and country specific sites such as Brazil, Norway, Mexico and China is used to provide a short term outlook.
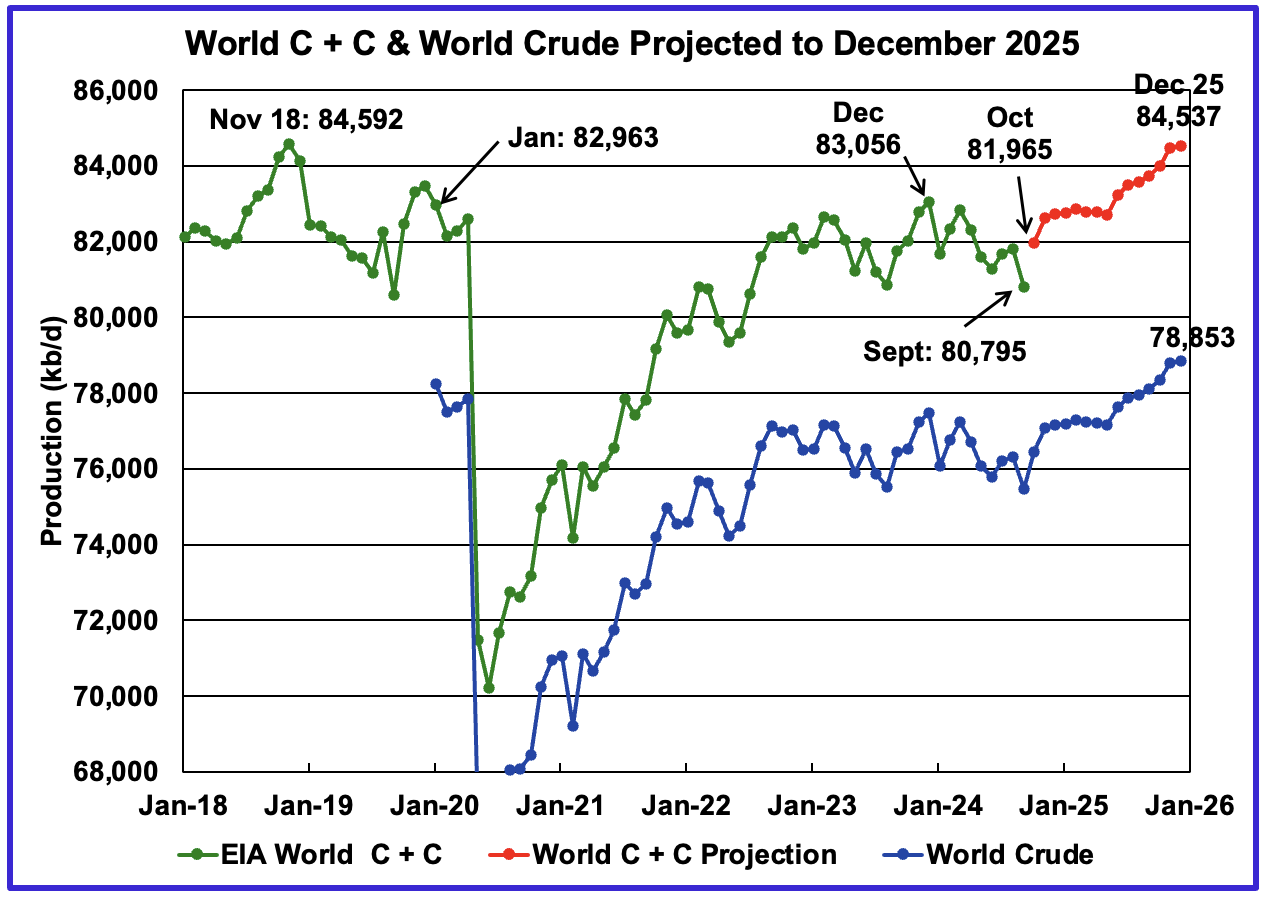
World oil production decreased by 1,014 kb/d in September to 80,795 kb/d, green graph. The largest decreases came from Libya, 350 kb/d, and Canada, 244 kb/d. October’s World oil production is projected to increase by 1,170 kb/d to 81,965 kb/d. Of that increase, Libya is expected to contribute close to 550 kb/d as its internal politics/oil dispute is settled.
Read MoreOpen Thread Non-Petroleum, January 11, 2025
Comments not related to oil or natural gas production in this thread please, thanks.
Read MoreNew Record High for U.S. October Oil Production
By Ovi
All of the Crude plus Condensate (C + C) production data, oil, for the US state charts comes from the EIAʼs Petroleum Supply monthly PSM which provides updated information up to October 2024.
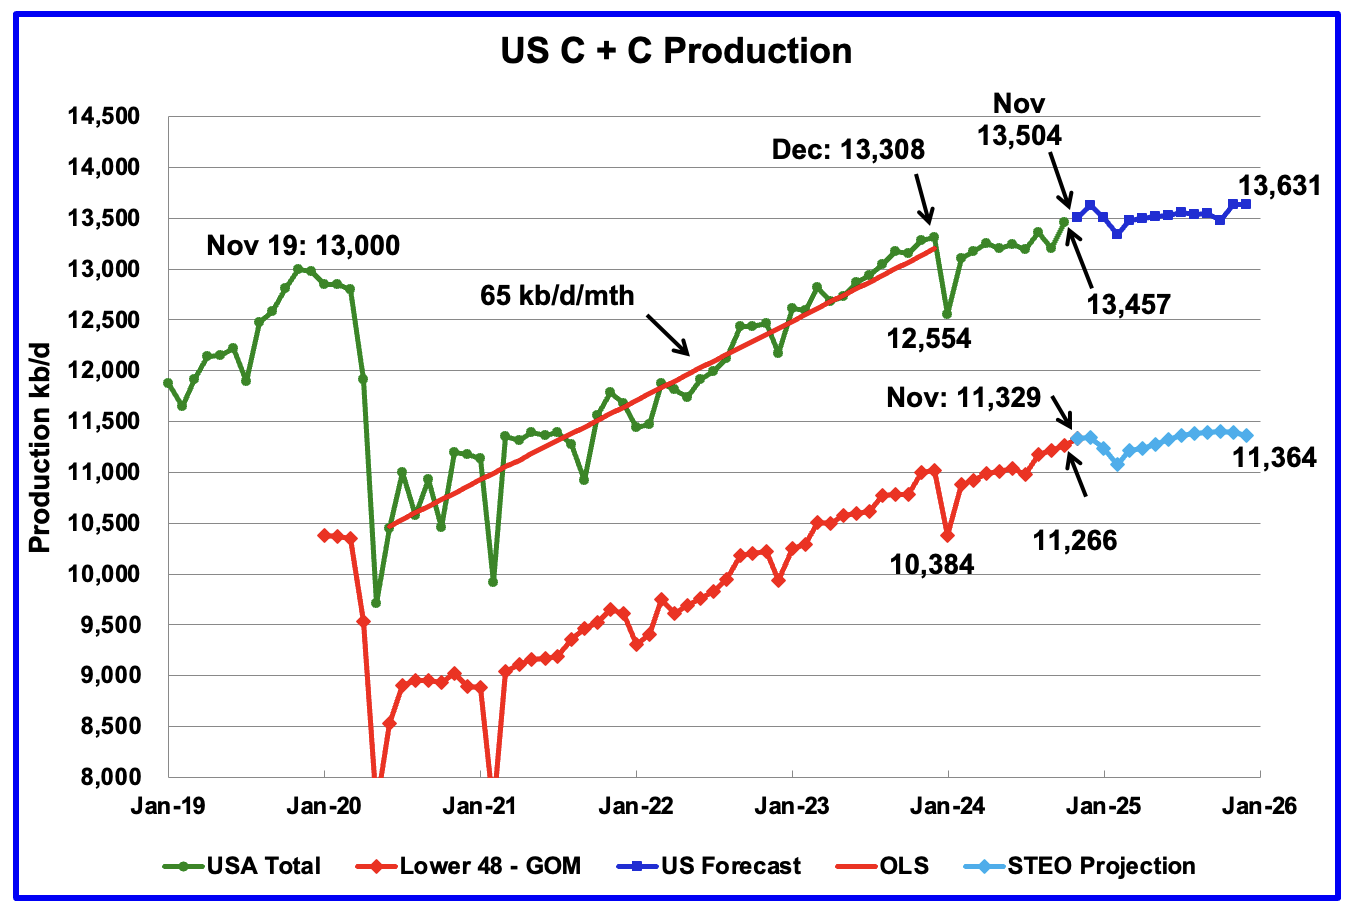
U.S. October oil production increased by 259 kb/d to 13,457 kb/d. The largest increases came from the GOM, 191 kb/d and Texas, 55 kb/d.
Read MoreOpen Thread Non-Petroleum, January 3, 2025
Comments not related to oil or natural gas production in this thread please, thanks.
Read More