A press release from The Carbon Capture and Sequestration Technologies Program at MIT, December 6, 2013, Bold mine.
Uthmaniyah Fact Sheet: Commercial EOR using Anthropogenic Carbon Dioxide
Company/Alliance: Saudi Aramco
Location: Saudi Arabia
Start Date: 2013/2014
Size: 0.8 Mt/yr
CO2 Source: Hawiyah gas plant
Transportation: 70 Km onshore pipeline
Oil Field EOR Storage Site: Ghawar field
Reservoir Type: Jurassic Carbonate limestones
Comments:
The objectives of the project are determination of incremental oil recovery (beyond water flooding), estimation of sequestered CO2, addressing the risks and uncertainties involved (including migration of CO2 within the reservoir), and identifying operational concerns. Specific CO2 monitoring objectives include developing a clear assessment of the CO2 potential (for both EOR and overall storage) and testing new technologies for CO2 monitoring.
Approximately 60–65% of all Saudi oil produced between 1948 and 2000 came from Ghawar. Cumulative production until April 2010 has exceeded 65 billion barrels. It was estimated that Ghawar produced about 5 million barrels of oil a day (6.25% of global production) in 2009. Ghawar also produces approximately 2 billion cubic feet of natural gas per day.
After 60 years of production, the field is depleted and Saudi Aramco is going to start CO2-EOR. The project will consist of 4 injection wells, 2 observation wells and 4 productions wells.
Is there any doubt anymore whether or not Ghawar is depleted? 2009 is likely the year when production began to fall fast in Ghawar. But it was already falling prior to that.
A bit of history. Three oil fields, discovered decades ago, were held offline because of economic and and other problems.
Shaybah: Discovered in 1968 but due to its remote location was not brought online until 1998 at 500,000 bpd. It was upgraded in 2009 and increased production to 750,000 bpd.
Khurais: Discovered in 1957 and brought online in 1959 and shut down in 1961 due to low production and remote location. It was brought back on line in the early 1970s. Khurais produced 144,000 bpd in 1981 but dropped off dramatically in 1982. Gas re-injection attempts to increase production failed and the field was shut down a short time later due to almost no natural pressure. In 2009 a new massive water injection program began with the injection of over 4 million barrels of water per day brought the field up to 1.2 million barrels of crude oil per day.
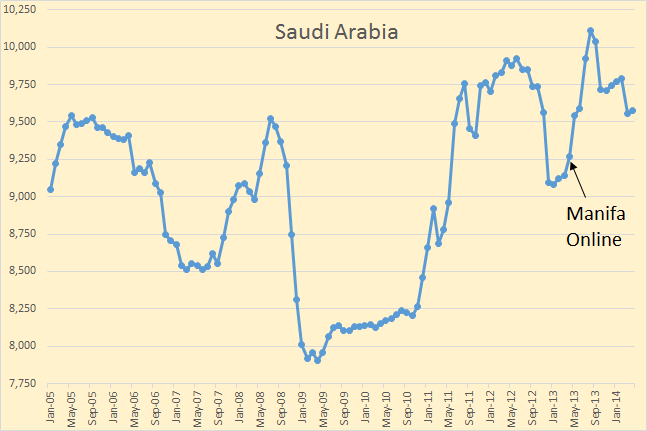
Manifa: Discovered in 1957 but shut down almost immediately because the oil was extra heavy and contaminated with vanadium. But Aramco built their own refineries to handle the oil. The field was put on line in April 2013 and was producing 500,000 bpd and will be producing 900,000 bpd in 2014.
It is these three fields that has kept Saudi production near 10 million barrels per day. But there are no more old fields to be brought on line. From here on out Saudi must rely on the fields it has.
Okay, we know that Ghawar is depleted and in serious decline. But so is Safaniya, Abqaiq, Berri, Abu-Safah, Qatif, Zuluf, Marjan, and all the smaller fields in Saudi Arabia.
Saudi has three fields with a combined production of 2.8 to 2.9 million barrels per day that are not in decline. Everything else is seriously depleted and in serious decline. Matt Simmons, Twilight in the Desert Stuart Staniford, A Nosedive Toward the Desert and Chip Haynes Ghawar is Dying, were all absolutely correct… they were just all premature with their prognostications. They had not counted on Khurais and Manifa.
Saudi is diversifying, making preparations to increase their finished product income when oil production declines: Change is coming to Saudi Aramco, the state oil company
Time was when Saudi Aramco didn’t need to worry much about its ability to deliver all the oil needed to maintain Saudi Arabia’s share of the global market…
A quick glance at Aramco’s 2013 Annual Review, published last week, is enough to convince anyone that change is in the wind for the flagship Saudi state-owned enterprise.
“We have embarked on ambitious corporate transformation guided by our Strategic Intent, our overall vision for Saudi Aramco through 2020,” the review states.
“These advancements will not only ensure that Saudi Aramco remains a global leader in crude oil and NGL production and exports, but will also propel us into the top tier of chemicals companies worldwide and reaffirm our commitment to the Kingdom’s future in a rapidly changing world.”
Read More
