Like BP, OPEC, the EIA and the IEA Russia also publishes an annual energy outlook. It is called the Global and Russian Energy Outlook to 2040. It is published by The Energy Research Institute of The Russian Academy of Sciences and The Analytical Center for The Government of The Russian Federation. I have no idea who these guys are but their titles sound impressive and they seem to be Russian think tanks funded by the Russian Government. But that is just an assumption of mine.
It is a very large 175 page PDF file that appears to be very scholarly and well researched. However they appear to be very optimistic in their prediction of the future oil supply out to 2040. In one scenario they are not optimistic at all for coal production however.
The report has three scenarios, the Baseline Scenario where business as usual continues until 2040. The New Producers Scenario where oil prices collapse due to overproduction and The Other Asia Scenario which is based on peak coal and the effect this will have on China and India. In that scenario they assume China coal production will peak within the next ten years. The Baseline Scenario assumes adequate supplies of coal will be available however. Only in the Other Asian Scenario do they figure in peak coal. All three scenarios assume plenty of oil will be available through 2040.
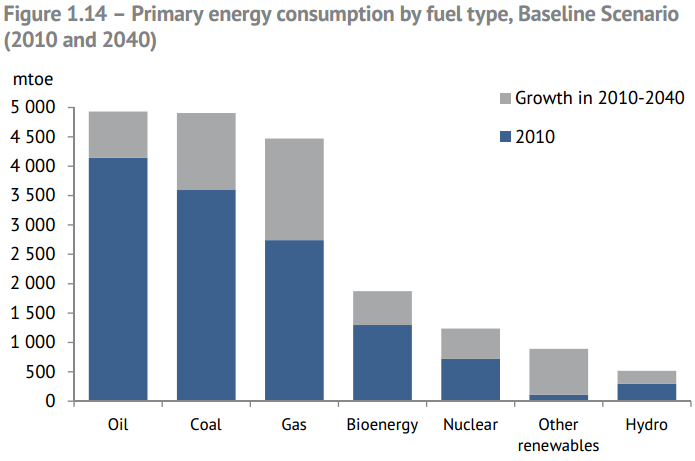 Obviously they don’t see any peak in oil production out to 2040, only growth. However they have coal and gas growing even more. And they seem to be very optimistic about “other” renewables. I don’t know exactly what that might be.
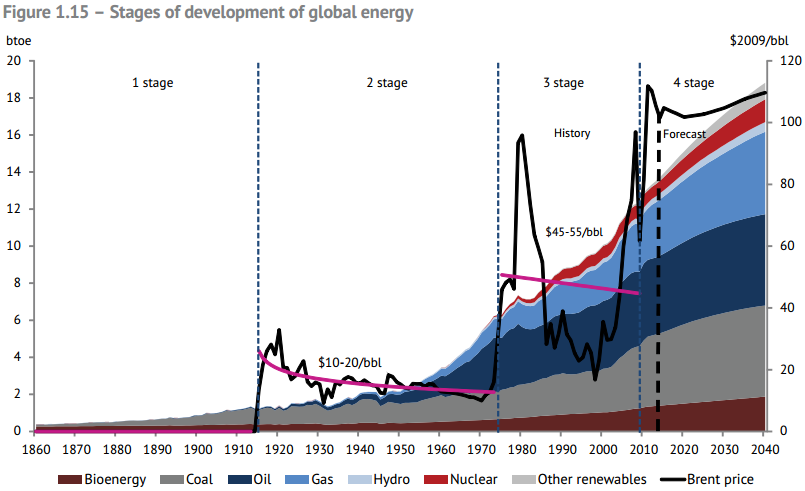
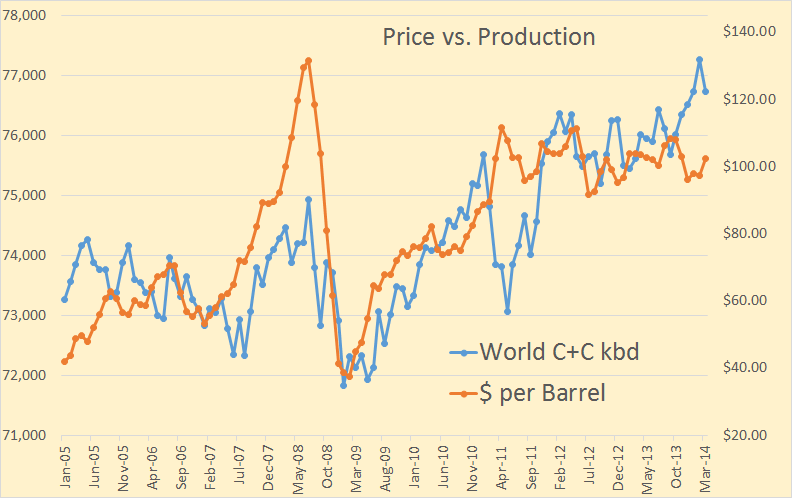
And here is their take with an oil price overlay. It appears they think, because production increases right along with demand, that the oil prices will remain flat.