There has been considerable debate lately on what effect the supply and price of oil is having on the economy. It is, to my mind, a lot more serious than the vast majority of economists believe. In fact one can just look at what is happening today to see the effect of a constrained oil supply and high oil prices. Just look at the unemployment rate:
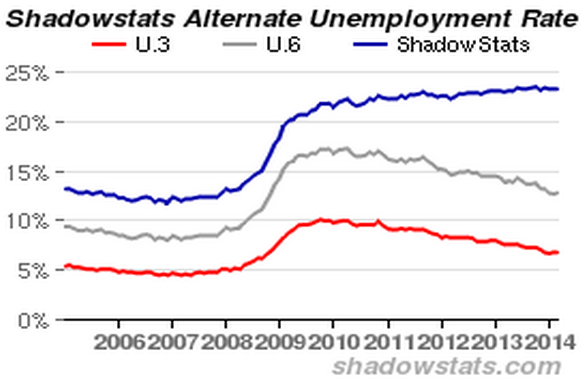
Real unemployment is double what it was in 2007. And it is creeping higher.
If you have not watched Oil Supply and Demand Forecasting with Steven Kopits then you have missed the best and most informative video that has come along since this whole debate started over a decade ago. I have just finished watching it for the third time. This time I made notes.
Kopits makes it very clear that oil is a binding constraint on economic growth. Of course that is obvious to most of us but you would be surprised at how many economists deny this. But for starters a few charts from Kopits video:
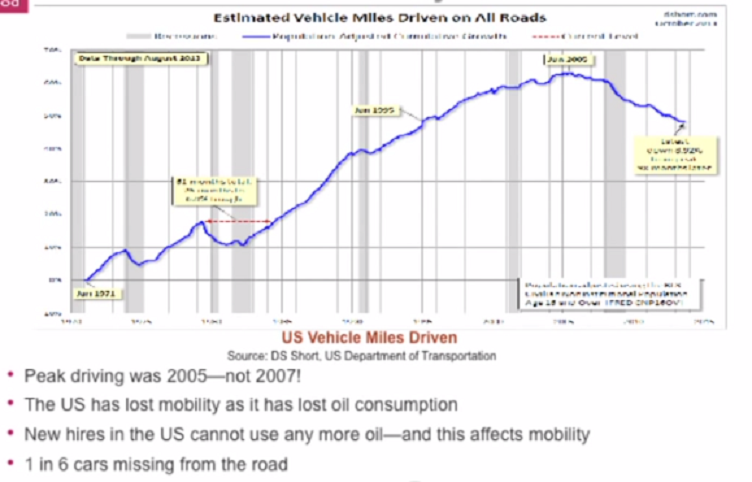
This is a direct result of the high price of oil.