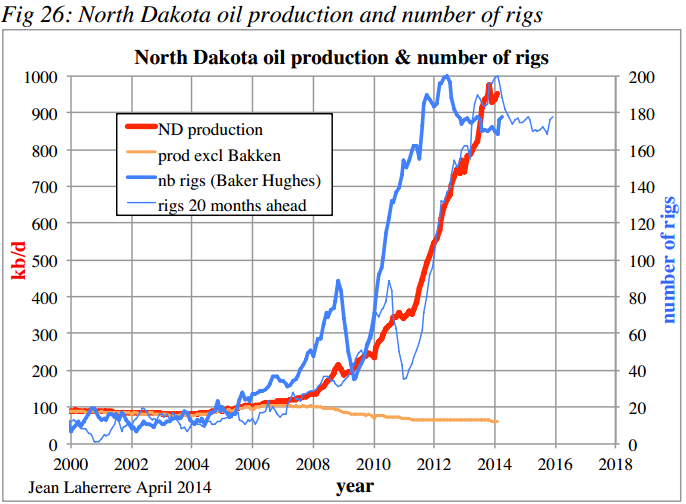
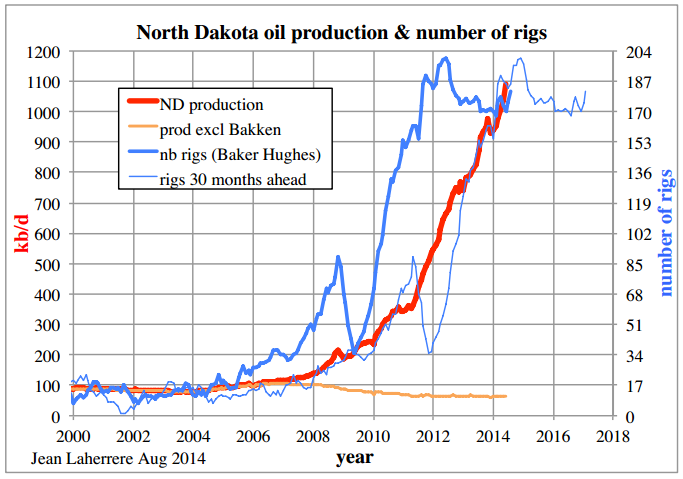
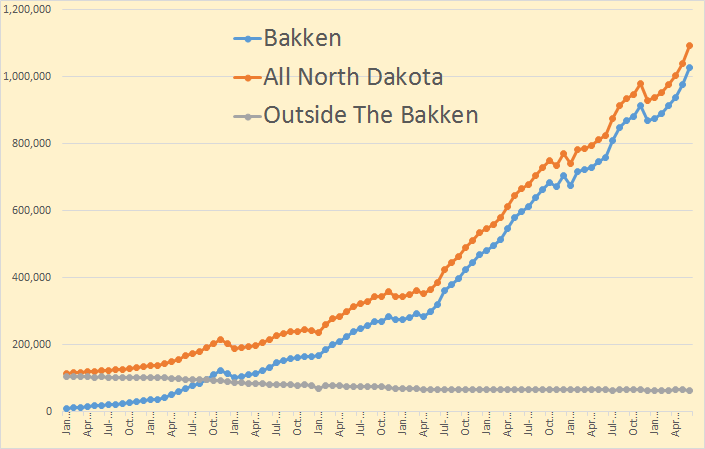
The Bakken and North Dakota production numbers are in for June. There was a big jump in oil production in June. The Bakken was up 53,162 barrels per day to 1,028,352 bpd. All North Dakota was up 52,148 bpd to 1,092,617 meaning the area outside the Bakken was down about 1,000 bpd.
From the Director’s Cut:
May Sweet Crude Price = $88.31/barrel
June Sweet Crude Price = $90.03/barrel
July Sweet Crude Price = $86.20/barrel
Today’s Sweet Crude Price = $79.50/barrel (all-time high was $136.29 7/3/2008)
The drilling rig count was up one from May to June, and up two more from June to July.
The number of well completions increased as weather impacts eased in June with
significant rainfall on 2 days near Minot and 1 day near Dickinson. However, there were
still 6 to 8 days with wind speeds in excess of 35 mph (too high for completion work).
At the end of June there were about 585 wells waiting on completion services, a decrease
of 25.
For the first time in a couple of years he did not give us the exact number of new well completions, only that they increased. Last month there were 227 well completions and production was up 37,000 bpd so we can assume there were aroun 235 to 240 new well completions in June.
Well completions should not be confused with “additional wells producing. That is and entirely different figure.
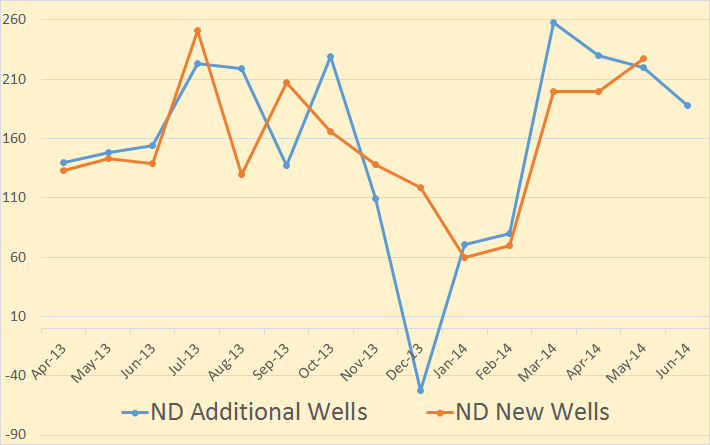
Additional wells producing is new wells completed, plus previously shut down wells brought back on, line minus wells shut down. Sometimes this number goes negative as it did in December of 2013. That month “Wells Producing” dropped by 52 even though there were 119 new wells completed. All data is barrels per day.
Read More