The Texas RailRoad Comission released their Oil & Gas Production Data with production data through July 2014. The data was actually released Thursday but was all messed up. They corrected their mistake Friday except for condensate. Then yesterday they updated everything. As I have stated before, the RRC data, for the last several months, is incomplete. Nevertheless we can gather some indication of what is happening.
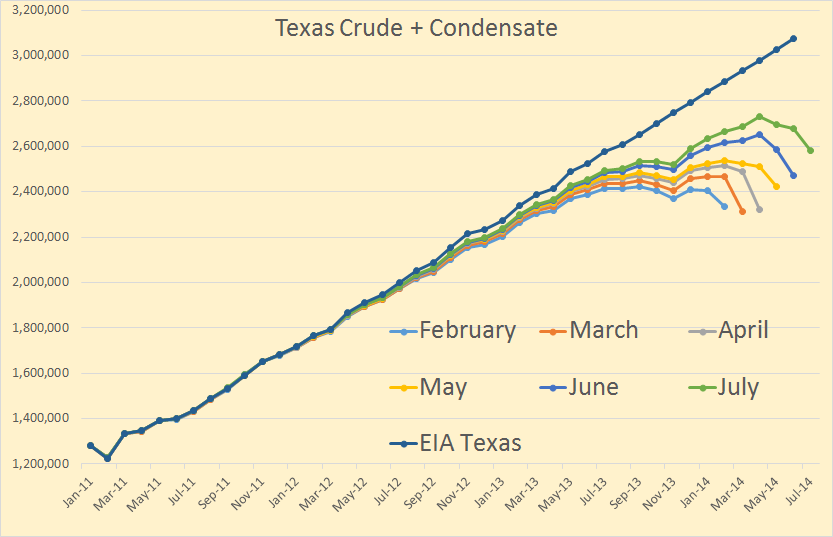
Texas C+C is still increasing at a pretty hefty clip. The EIA data is just an estimate of course but I think it is pretty close to what the data will show when it is all in. I have included six months of data to show how it is increasing month to month.
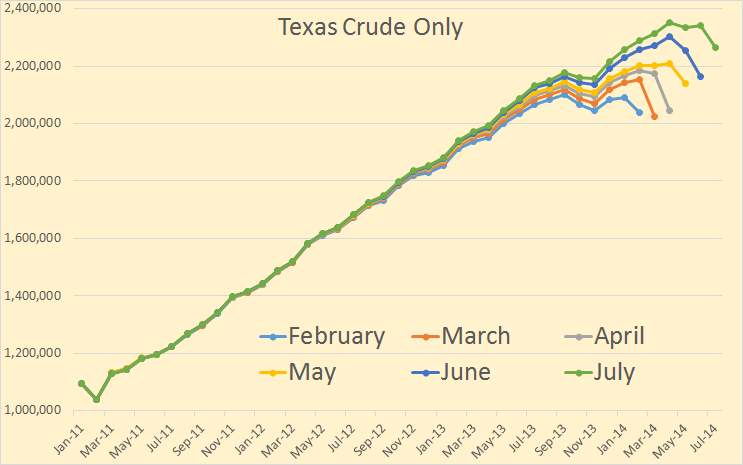
Texas crude only was down in October and November but has been up every month since. The declines in the last few months is due to incomplete data.