Bakken and N.D. Update for July

North Dakota has released their Bakken and North Dakota production numbers for July.

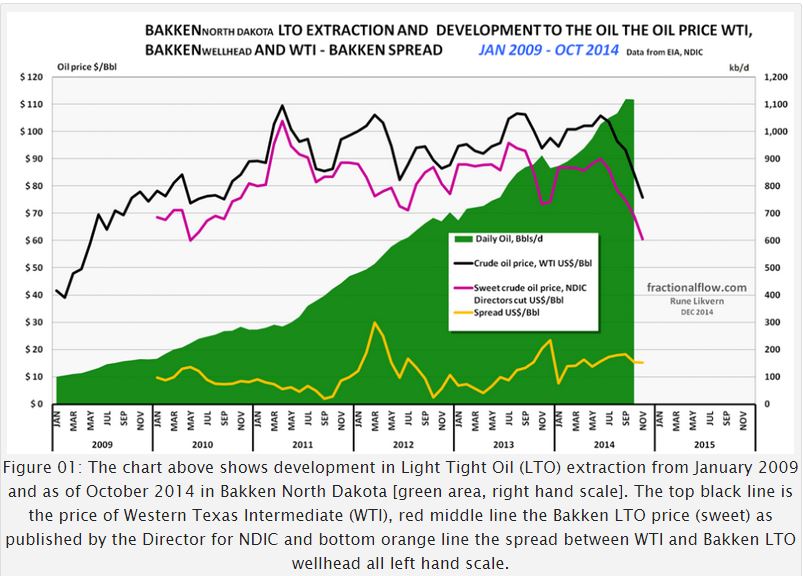
Bakken Barrels Per Day

Bakken production was up 19,456 bpd while all North Dakota production was up 18,134 barrels per day. This means that North Dakota production outside the Bakken fell by 1,322 bpd or a little over 2%.

Bakken Wells

Bakken wells producing increased by 195 to 8,065. North Dakota wells increased by the same amount to 10,952 so non-Bakken wells were unchanged at 2,860.

Read More

OPEC MOMR Update, August Production Numbers

The latest OPEC Monthly Oil Market Report is out with OPEC production numbers for August 2014. OPEC production was up 230,000 barrels per day but that was after July had been revised upward by 210,000 barrels per day. So OPEC production was up 430,000 bpd from what they reported last month.

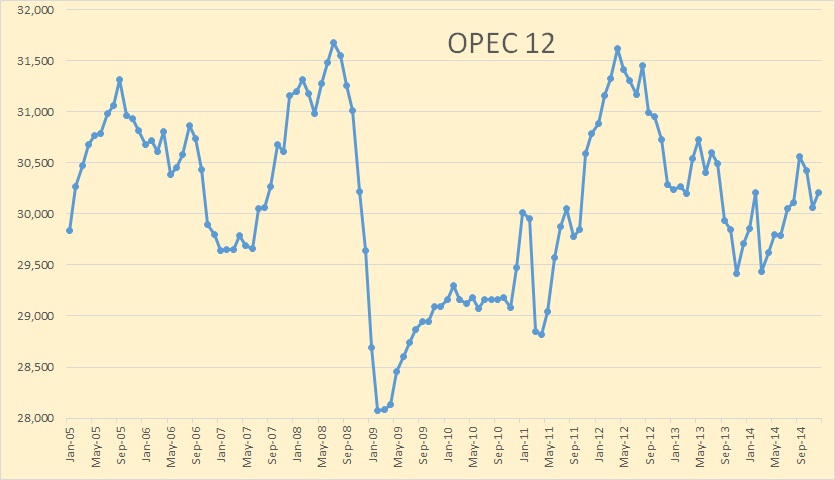
OPEC 12

OPEC crude only production now stands at 30, 347,000 barrels per day, a one year high.

Saudi Arabia

Saudi Arabia’s production dropped 55,000 bpd in August but that was after their July production had been revised upward by 99,000 bpd.

Read More

The EIA’s Drilling Productivity Report

The Eia’s latest Drilling Productivity Report is out. However they have only updated the PDF file. The spreadsheets have not been updated and still have last month’s data. But I will give you what the PDF file shows and perhaps add some charts tomorrow if they get around to updating the Excel spreadsheets.

DPR 1

The EIA says Bakken new wells will produce 100,000 bpd in October but all the old wells will decline by 73,000 bpd and leave a net increase of 27,000 bpd. If these numbers are correct and September production was 1,152,000 bpd then that means the monthly decline rate is 6.33%.

DPR 2

The EIA says Eagle Ford new wells will produce 154,000 bpd in October but all the old wells will decline by 123,000 bpd and leave a net increase of 31,000 bpd. If these numbers are correct and September production was 1,551,000 bpd then that means the monthly decline rate is 7.93%.
Read More

Petroleum Supply Monthly and Other News

The EIA’s Petroleum Supply Monthly has just come out. That report gives production from individual states as well as offshore production.

The below chart is thousand barrels per day with the last data point June 2014.

GOM BSEE

For February, March and April there is about 60 thousand barrel per day difference between what the EIA and BSEE reports. Eventually the EIA and BSEE will be the same and it will be the EIA data that suffers the greatest revisions. I believe they have the June GOM numbers quite a bit too high here.

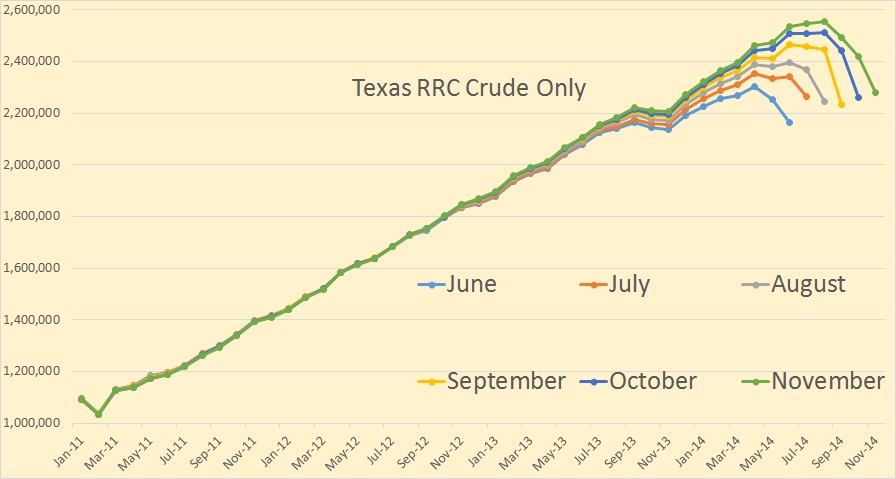
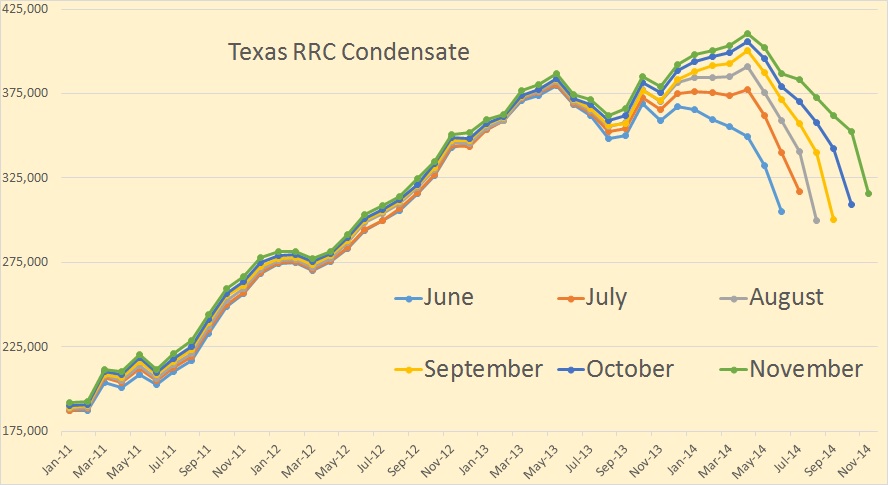
Texas 1

The EIA is still tweaking its guess as to what Texas production will be when it finally comes in.
Read More

Who’s Got Liquids? plus Further to the Bakken

This is another Guest Post by David Archibald

Who’s Got Liquids?

An article by Canadian consultant Mike Priaro in the 7th July, 2014 edition of Oil andGas Journal, “Grosmont carbonate formation increases Alberta’s bitumen reserves”, included the following tables:

David 1

Mr Priaro’s estimate of Canada’s recoverable bitumen is 818 billion barrels. Almost all of that is in Alberta. Combined with their coal resources, Alberta has the biggest fossil fuel resource on the planet. I have updated my estimate of what some of the major countries have in the way of fossil fuels in this table:

David 2

The highest value fuels are those that can be used as liquids in transport. High quality coal produces 2.2 barrels of liquids through a FT plant. In the following graphic I have used a factor of 2x to convert coal to its oil equivalent. Six thousand cubic feet of gas has the energy equivalent of one barrel of oil. Natural gas can be used directlyin some transport applications. Putting it through an FT plant to make diesel, for example, would lose at least 30% of its initial energy. Natural gas has traditionally traded at the oil price in the US and conceivably might return to close to that level in a tight market. So in the following graph, natural gas in TCF is divided by six to produce its oil equivalent in billions of barrels. This is the graph:

David 3

Read More