Comments not related to oil or natural gas production in this thread please, thanks.
Read MoreJanuary Non-OPEC and World Oil Production Drops
By Ovi
The focus of this post is an overview of World oil production along with a more detailed review of the top 11 Non-OPEC oil producing countries. OPEC production is covered in a separate post.
Below are a number of Crude plus Condensate (C + C) production charts, usually shortened to “oil”, for the oil producing countries. The charts are created from data provided by the EIA’s International Energy Statistics and are updated to January 2025. This is the latest and most detailed/complete World oil production information available. Information from other sources such as OPEC, the STEO and country specific sites such as Brazil, Norway, Mexico, Argentina and China is used to provide a short term outlook.

World oil production decreased by 231 kb/d in January to 82,184 kb/d, green graph. The largest decrease came from the US, 305 kb/d. February’s World oil production is projected to increase by 400 kb/d to 82,584 kb/d.
Read MoreOpen Thread Non-Petroleum May 10, 2025
Comments not related to oil or natural gas production in this thread please. Thank you.
Read MoreUS February Oil Production Marginally Higher
By Ovi
All of the Crude plus Condensate (C + C) production data, oil, for the US state charts comes from the EIAʼs Petroleum Supply monthly PSM which provides updated information up to February 2025.
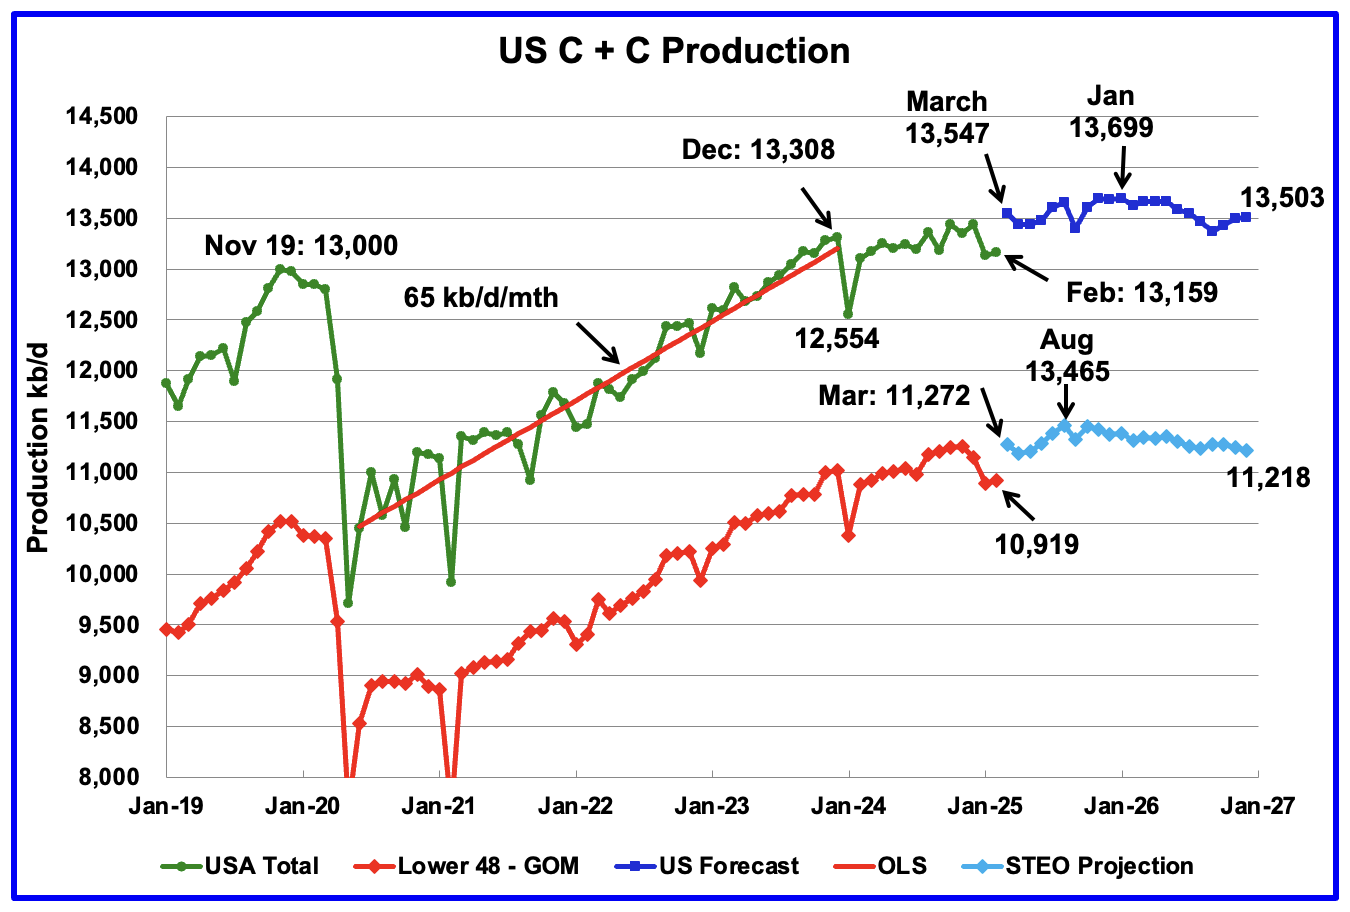
U.S. February oil production increased by 29 kb/d to 13,159 kb/d, 149 kb/d lower than December 2023’s 13,308 kb/d. The largest increases came from Texas and New Mexico. January’s production was revised down from last month’s 13,146 kb/d to 13,130 kb/d a decrease of 16 kb/d which is more than one half of February’s increase.
Read MoreOpen Thread Non-Petroleum, May 3, 2025
Comments not related to oil or natural gas production in this thread please. Thanks.
Read More