Texas RRC November Production Report

The Texas RRC Data Base came out a few days ago. The data is reported through September but of course it is incomplete. The data from the field comes in very slow in Texas and the RRC only reports the data they receive. All data is through September and is in barrels per day.

Texas Crude Only

Crude only has shown a slight downward trend for the last two months. After revision, when the final data comes in, production will likely still be up slightly but if this is any indication, it will be up less than in months past.

Texas Condensate

Texas condensate production started a dramatic slowdown in June of 2013. It actually declined three months in a row, June, July and August of 2013 but then started to recover. But production growth has slowed since that date.

Read More

Gulf of Mexico Crude Oil and Gas Production

This is a guest post by Jean Laherrere

BOEM and BSEE have published in 2014 the GOM oil & gas reserves at end 2010 few months ago and at end 2011 lately.

The big change is that they now report proved and probable reserves = 2P (in contrary to SEC rules for operators reporting at the US Stock Exchange, forbidding to report probable reserves), when before they reported only proved reserves = 1P

They argue:

In order to more closely align BOEM GOM reserves definitions with the Petroleum Resources Management System definitions (SPE/AAPG/WPC/SPEE 2007), this report clarifies that Proved Reserves in this and previous reports are Proved plus Probable (2P) estimates.

The difference between original reserves estimates from previous year found little difference for discoveries before 1995

The difference between 2P 2011 and 2P 2010 is a very large decrease for Thunder Horse (-488 Mb or 573 Mboe) and the largest increase is Great White +73 Mb

Jean 1

The difference between 2P 2010 and 1P 2009 displays a large increase in Tahiti +169 Gb and large decrease with Atlantis -92 Mb (already in decrease in 2009)

Jean 2

The difference between 1P 2009 and 1P 2008 is as important as the difference between 2P and 1P: large increase with WD 030 +61 Mb and large decrease for Atalntis -161 Mb

Jean 3

The change in reserves with time  and definitions does not change the estimate on GOM ultimates: 24 Gb and 210 Tcf
Read More

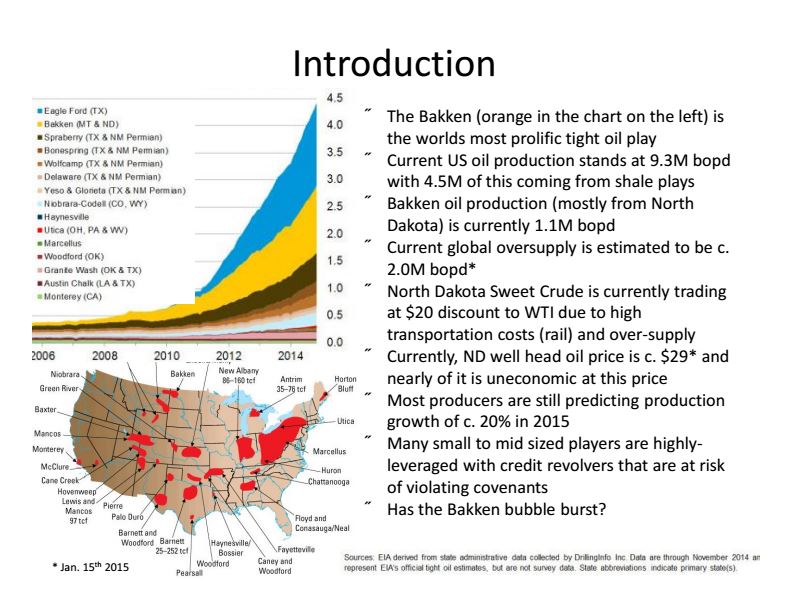
Bakken September Production Data

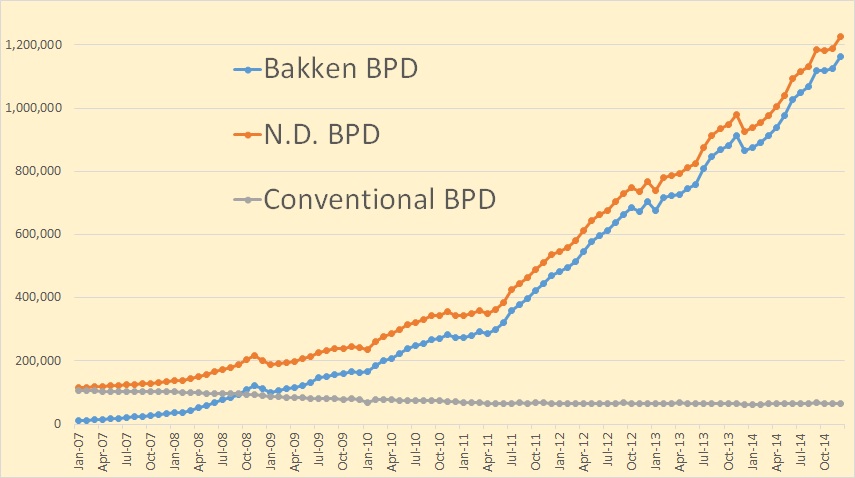
North Dakota just released the Bakken September Production Data as well as the September Production data for all North Dakota.

There was a suprisingly hefty increase in Bakken production in September, up 52,568 bpd to 1,120,031 bpd.

Bakken Barrels Per Day

North Dakota production was up slightly less, 52,394 bpd to 1,184,693 bpd. This means production outside the Bakken was down slightly.

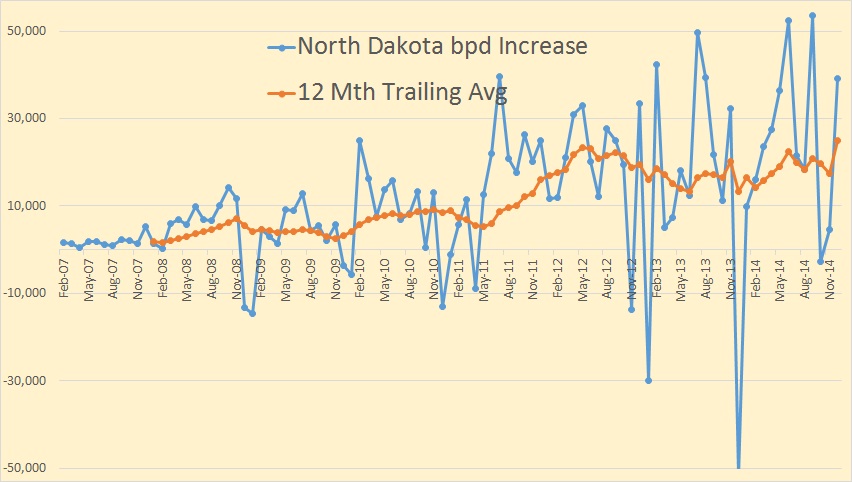
Bakken Barrels Per Day Increase

These big increases happen ever so often and are usually followed by a not so large increase for a few months. I think there is some kind of reporting anomaly here. But as you can see the 12 month average increase gives a better indication of what is really going on.
Read More

OPEC MOMR October Production Data

OPEC just published their November Monthly Oil Market Report which contains crude only production data for all OPEC nations. The only big surprise was that everyone had declining production except Libya and Algeria, that is according to “secondary sources”.

OPEC Secondary Sources

I find it interesting that Venezuela has, for the last several months, refused to give OPEC their production data.

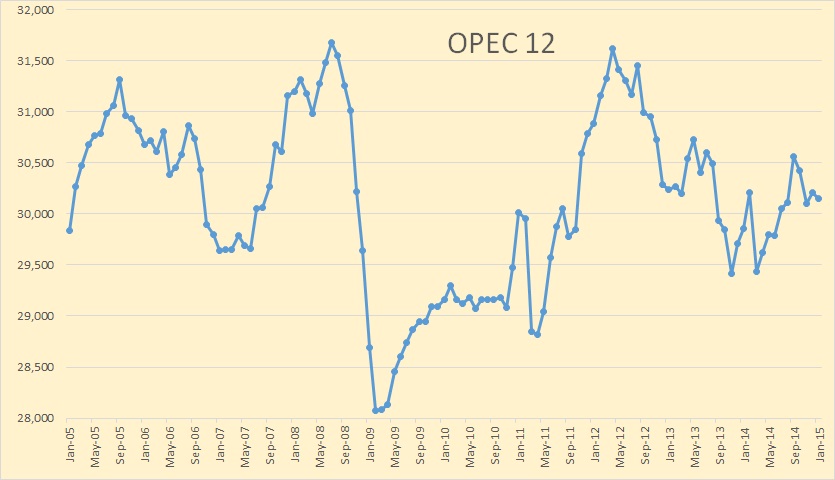
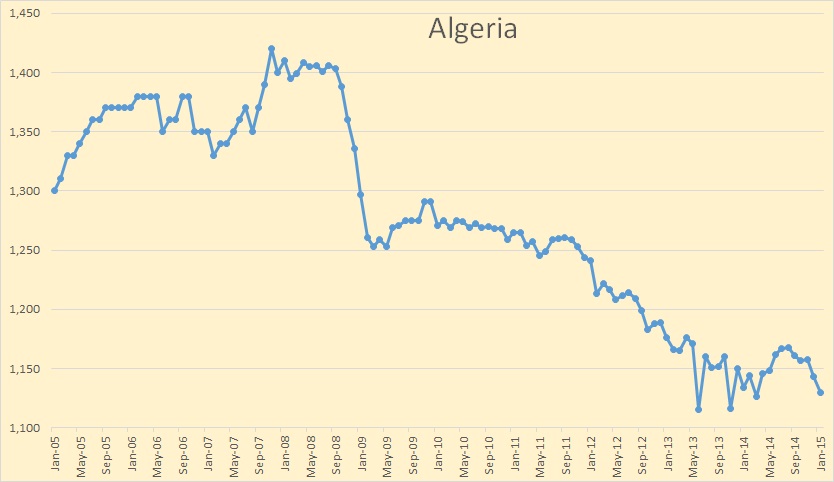
All charts below are in the charts below are in thousand barrels per day with the last data point October 2014 and is based on OPEC’s “secondary sources”. I have decided to post all OPEC charts in this post.

OPEC 12

OPEC production declined 226,000 bpd. September production was revised only slightly, up 5,000 bpd.

Algeria

Algeria has stopped their decline, temporally at least.

Read More

The EIA’s International Energy Statistics 2

The EIA, a few days ago posted their International Energy Statistics. They publish lots of statistics here but on monthly basis I only follow their  production of world Crude Oil including Lease Condensate.

The data on all charts below is Crude + Condensate production through July 2014 and is in thousand barrels per day.

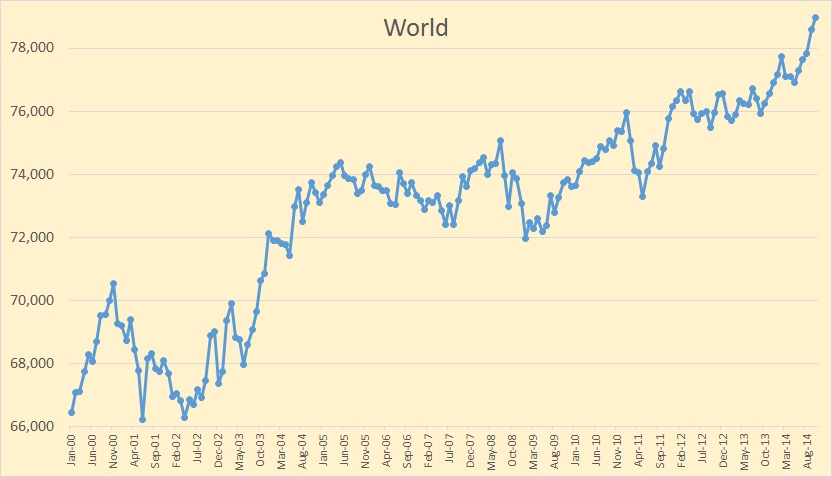
World

World C+C production was up 168,000 bpd to 77,023,000 bpd. The high, so far, was in February at 77,409,000 bpd.

Non-OPEC

Non-OPEC C+C was down 135,000 bpd from it high so far. It has been on a 9 month plateau high.

Read More