What Will 2015 do for Peak Oil?

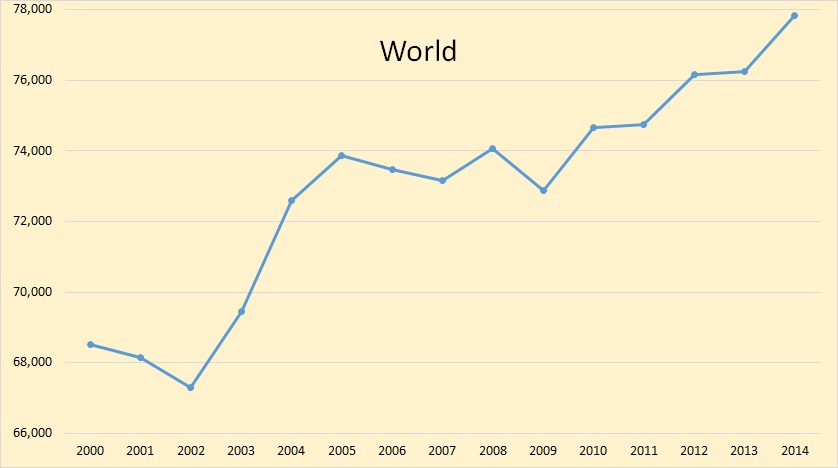
The Cornucopians are exuberant, they believe that collapsing of oil prices dealt the death knell for peak oil. An oil glut, they say, is what we have, not peak oil. But an oil glut is exactly what we would expect at the very peak. After all, that is what peak oil is, that is the the point in time when the world produces more oil than ever in history… and the most it ever will produce.

I am of the firm conviction that the world is at the peak of world oil production right now, or was at that point three or four months ago. I think history will show that the 12 months of September 2014 through August 2015 will be the one year peak. Whether the calendar year peak is 2014 or 2015 is the only thing still in question, or that is my opinion anyway.

The EIA says, in their Short Term Energy Outlook says US Crude oil will peak, at least temporarily, in May 2015.

STEO 1

Looking at the area breakdown for total US production:

STEO Total US

This chart includes net US crude oil imports. Notice how they expect crude oil imports to bottom out in February of 2015 at 5.78 mbd then increase to 6.71 mbd in August before declining to 5.82 mbd in December.

Read More

Bakken, Let’s Do The Math

There has been considerable dispute over how many new wells required to keep production flat in the Bakken and Eagle Ford. One college professor posted, over on Seeking Alpha, figures that it would take 114 rigs in the Bakken and 175 in Eagle Ford to keep production flat. He bases his analysis on David Hughes’ estimate that the legacy decline rate fir Bakken wells is 45% and 35% for Eagle Ford wells. And he says a rig can drill 18 wells a year, or about one well every 20.3 days.

The EIA has comes up with different numbers. The data for the chart below was taken from the EIA’s Drilling Productivity Report.

Legacy Decline

The EIA has current legacy decline at about 6.3% per month for Bakken wells and about 7.7% per month for Eagle Ford wells. That works out to be about 54% per year for the Bakken and 62% per year for Eagle Ford. I believe the EIA’s estimate of legacy decline, in this case, is fairly accurate. For instance last month Mountrail County had over 30 new wells completed yet still declined by 6.4%. And in December 2013 North Dakota declined by 5.22% yet had 119 new well completions.

I have examined the last sixteen Directr’s Cuts and gleaned, I think, some important data… I think.

New Well Completions

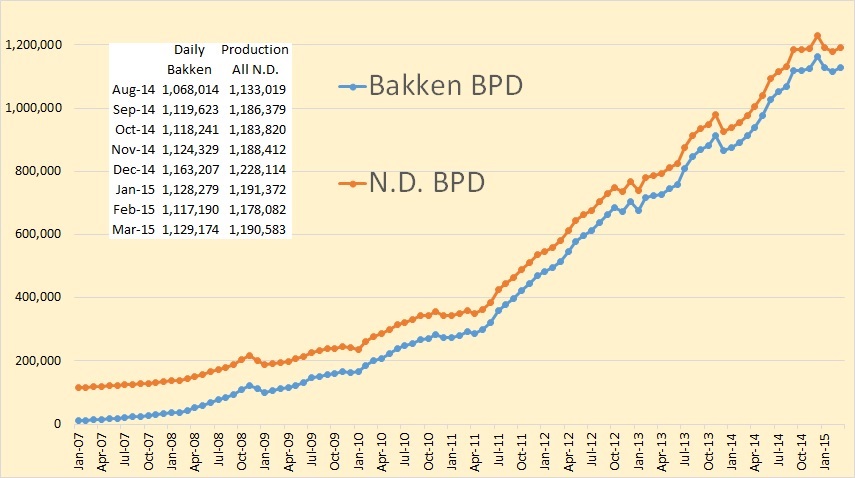
Rig count has averaged 189 rigs per mnth and has been fairly steady while new well completions has averaged 172 wells per month but has been highly erratic.

New well completions depends far more on weather and fracking crews than rigs. In October there was 650 wells awaiting fracking crews. At 172 wells per month that is almost a four months supply. And that is also what the average spud to completion is, 120 days.

Read More

Peak Oil from the Demand Side: A Prophetic New Model

Peak Oil from the Demand Side: A Prophetic New Model

This is a Guest post by Avery Morrow
Avery Morrow’s Internet Fancy

The most attention-grabbing attempts to predict oil futures have come from geologists and environmental activists, who tend to look solely at production. An overlooked doctoral thesis by Christophe McGlade, Uncertainties in the outlook for oil and gas, in contrast, focuses on how both supply and demand might be constrained in the coming decades. Peak oil researchers should take note of McGlade’s thesis because he predicted, in November 2013, that oil prices would sink, and that they will stay low throughout the second half of this decade. I found this paper on Google Scholar and have no connection with the author, but I appreciate his careful consideration of peak oil arguments, and his ability to distance himself from the more narrow-minded aspects of both economic and geological thinking. Here’s a representative quote from the middle of the thesis, p. 216:

The focus of much of the discussion of peak oil is on the maximum rates of conventional oil production. Apart from issues over how this term is defined, results suggest that focussing on an exclusive or narrow definition of oil belies the true complexity of oil production and can lead to somewhat misleading conclusions. The more narrow the definition of oil that is considered (e.g. by excluding certain categories of oil such as light tight oil or Arctic oil), the more likely it is that this will reach a peak and subsequent decline, but the less relevant such an event would be.

Advocates for peak oil often try to fit oil production to a curve based solely on an idealized image of production. Indeed, when nothing unusual happens on the downslope, oil production looks like a Hubbert curve, especially on micro levels. But at the macro levels, unusual things do happen: for example, the shale boom. McGlade argues that pessimists have failed to acknowledge that now that conventional oil has reached its peak, we should not expect a smooth ride down, but rather we should expect the unexpected, such as discoveries of new methods of production or adjustments in demand. Oil production is an artificial, not a geological, process, and nothing about the way oil is produced at the macro level demands that it must look like a bell curve. Of course it is impossible to actually know what factors will really affect demand at a global scale, but the IEA considers two central scenarios which McGlade aims to apply to the future of oil (p. 174). One is the “low-carbon scenario” (LCS), in which the world’s governments take immediate and unprecedented action to keep anthropogenic warming below 2°C. The other is the “new policies scenario” (NPS), where new policies are adopted, but are insufficient for capping the temperature rise. This is assumed by the IEA to be what current green energy policy is actually pointing towards. McGlade does not even bother to model the IEA’s “current policies scenario” (aka “business as usual”), where very little is done to stop carbon emissions. It is hard to know whether the NPS has actually been implemented by IEA member states, but we will see that the NPS is disastrous enough.

Figure 10.12: Production of oil in the United Kingdom in NPS (top) and LCS (bottom)

BritainBritain 2
Read More

World Oil Production, September Numbers

The EIA has published International Energy Statistics with Crude + Condensate numbers for September 2014. As most of you know I only follow Crude + Condensate because I believe that biofuels and natural gas liquids should not be part of the peak oil equation.

The data in all charts is thousand barrels per day with the last data point September 2014.

World

World oil production was up 1,270,000 barrels per day in September. This was somewhat of a shocker. I had expected production to be up about .9 mbd but not this much.

Non-OPEC

Non-OPEC nations accounted for 833,000 bp/d of the increase.

OPEC C+C

And OPEC nations accounted for 438,000 bpd of the increase. The EIA said OPEC produced 32,734,000 barrels per day of C+C in September. OPEC’s “secondary sources” said OPEC produced 30,560,000 barrels of Crude Only in September. OPEC’s crude only production had dropped to 30,053,000 bpd in November, or over half a million barrels per day lower.

Read More

Bakken, A Tale of Two Counties

North Dakota publishes their Historical Barrels of Oil Production by County which gives county by county production back to 1951. The data here does not include confidential wells but they publish the last couple of months production data that does include confidential wells here: Oil and Gas Production Report. Looking over this data I found something very strange. In October Bakken production was down by 1,598 barrels per day and all North Dakota was down by 5,4054 barrels per day.

All data is in barrels per day with the last data point October 2014.

McKenzieMcKenzie County was up 19,609 barrels per day or 4.88 percent. In October McKenzie was up even more than it was in September when the Bakken was up 52.5 thousand barrels per day.

Mountrail

Mountrail Countywas down 18,728 barrels per day or 6.42 percent. There is  more on this story below.

Dunn

Dunn County was down 3,527 barrels per day or 1.83 percent.
Read More