STEO
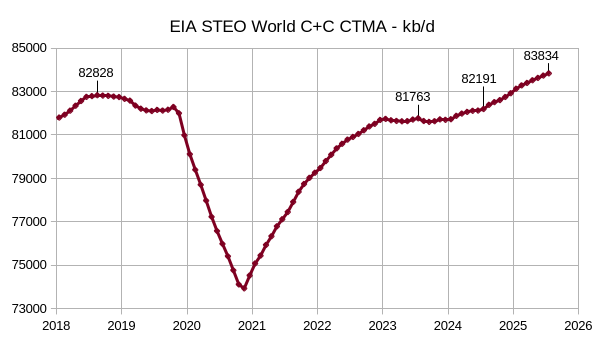
The EIA’s Short Term Energy Outlook (STEO) was published in early January. The chart below estimates World C+C by using the STEO forecast combined with past data from the EIA on World Output.
STEO
The EIA’s Short Term Energy Outlook (STEO) was published in early January. The chart below estimates World C+C by using the STEO forecast combined with past data from the EIA on World Output.
Comments not related to oil or natural gas production in this thread please. Thank you.
Read MoreBy Ovi
All of the Crude plus Condensate (C + C) production data for the US state charts comes from the EIAʼs Petroleum Supply monthly PSM which provides updated information up to October 2023.
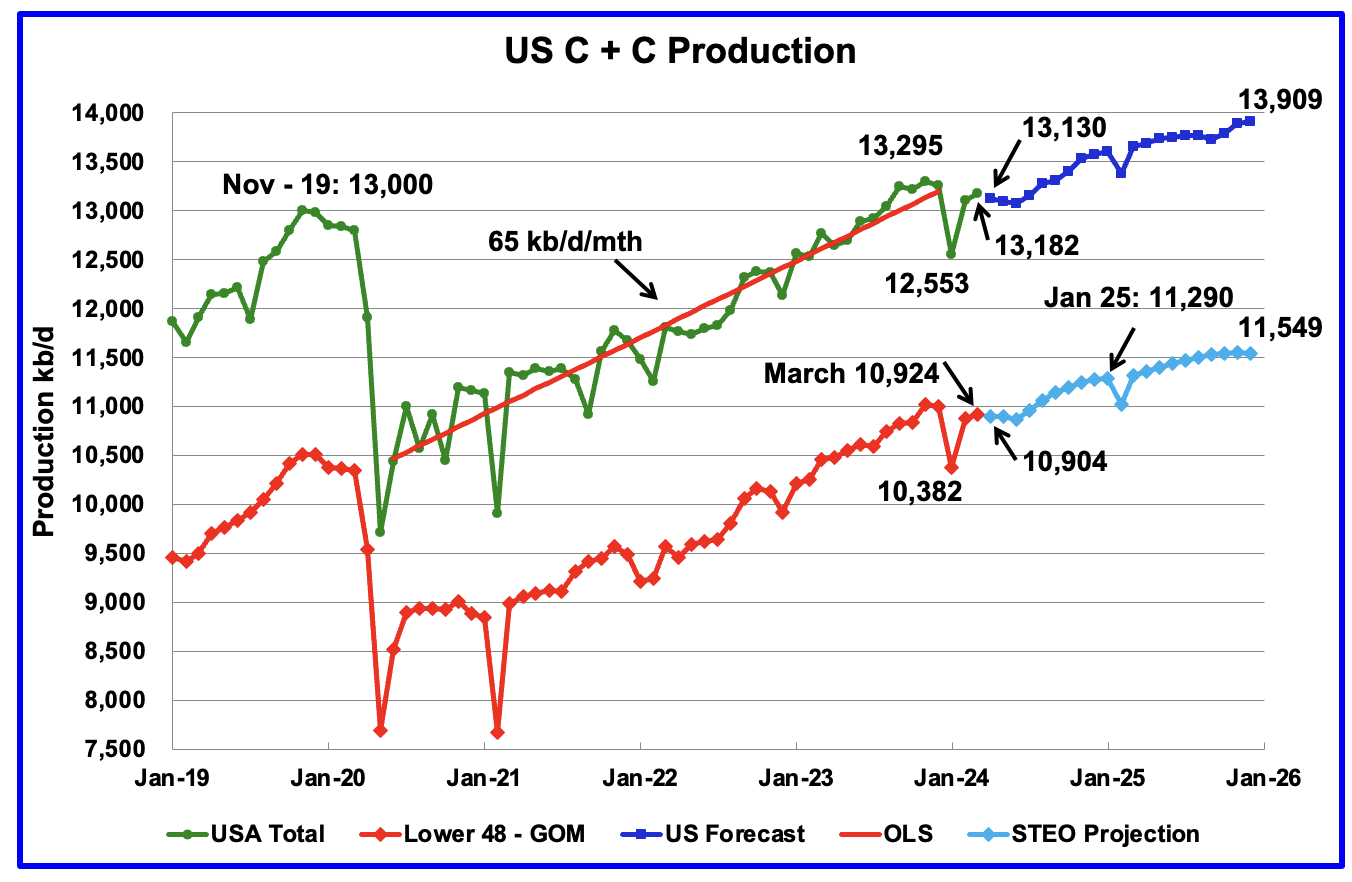
U.S. October oil production decreased by 4 kb/d to 13,248 kb/d. The decrease was primarily due to decreases in the GOM and North Dakota being partially offset by increases in Texas and New Mexico. Note that September production was revised up from 13,236 kb/d to 13,252 kb/d.
Read MoreComments not related to Oil or Natural Gas production in this thread please. Thank you.
Read MoreSTEO
The EIA’s Short Term Energy Outlook (STEO) was published in early December. The chart below estimates World C+C by using the STEO forecast combined with past data from the EIA on World Output.