US Oil Reserve Growth

This is a guest post by Dennis Coyne.

The views expressed in this post are those of Dennis Coyne and do not necessarily  represent those of Ron Patterson.

How much oil can be extracted from known oil resources profitably? This depends on many factors, the price of oil and technological progress in oil extraction methods are the chief factors, but improved knowledge gained through the development wells drilled and the corresponding output and geological data as known reserves are developed is important as well. Oil reserves do not grow, they deplete as the oil is produced. With increasing knowledge, oil price, and improved technology and production methods, the estimate of oil reserves changes over time and on average these estimates tend to increase, this is what we mean by reserve growth.

The United States Energy Information Administration (EIA) has detailed data on proven (1P) reserves and proven discoveries from 1977 to 2013, but Jean Laherrere has taught us that it is proved plus probable (2P) reserves that we should focus on.

Read More

OPEC according to the EIA

OPEC publishes monthly production data for all OPEC nations in their Monthly Oil Market Report. The data crude oil production only and does not include condensate. I have found the data to be highly accurate and any errors are corrected in the next month’s report or the month following that. The OPEC data is from OPEC’s “Secondary Sources”.

The EIA also publishes OPEC production data in their International Energy Statistics. However the EIA does not publish crude only data. Their data includes condensate.

All data is in thousand barrels per day. The last EIA data point is December 2014 and the last OPEC data point is April 2015.

O v E Algeria

Almost 20% of Algeria’s production is condensate if the EIA is correct. Algeria does produce a lot of condensate but I have serious doubts about the accuracy of the EIA data. As you can see from the chart the EIA has Algeria’s production absolutely flat for 24 months, from January 2010 through December 2011. But both the EIA and OPEC agree on one point, Algeria is in decline.

Read More

World Exports versus Consumption, The ELM

The EIA has updated their International Energy Statistics with annual production numbers through 2014 and export data through 2012. Sometimes these stats can be confusing as they include several types of production and exports. But for production I use only “Crude plus Condensate” and for exports I used “Crude Oil Exports” which I assume includes condensate as well.

Also the export data is not exact, just close, because some importers are also exporters. For instance in 2001 the US exported 59,000 barrels per day. In 2012 the US exported 629,000 barrels per day. The exporting of condensate is allowed in the US and since the Shale boom condensate exports have increased quite dramatically because Light Tight Oil is rather top heavy with condensate.

To get exports versus consumption for exporting nations I simply subtracted their exports from their production. The difference was what they consumed. Similar data can be found on the Energy Export Databrowser.

I think the data clearly endorses Jeffrey Brown’s Export Land Model.

World E v C

In 2012 76,160,000 barrels of C+C were produced per day. Of that 76 million barrels 42,845,000 barrels were exported while the other 33,315,000 barrels was consumed by the producing nations. That is this is oil that was never exported.

Read More

Texas RRC March Production Data

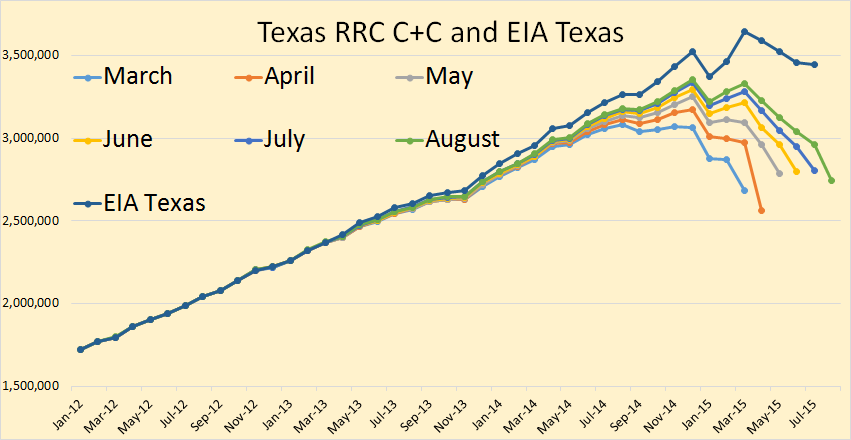
The Texas RRC is out with their latest Oil and Gas Production Data. Looks like oil production has leveled out with March production pretty much level with February. All RRC data is trough March 015.

Texas Crude Only

I always show the last 6 months or the RRC data in order to get a pretty good indication of which way data production is moving. From the data you can see that December was a very good month but January was just awful. February was a lot better and March was about the same as February.

Dean 1

The chart above was created by Dean Fantazzini, PhD, of the Moscow School of Economics. He has developed an algorithm which predicts what the data will reflect after the final data has come in. His data suggests that Texas crude has plateaued.

Read More

Bakken by County and Legacy Decline

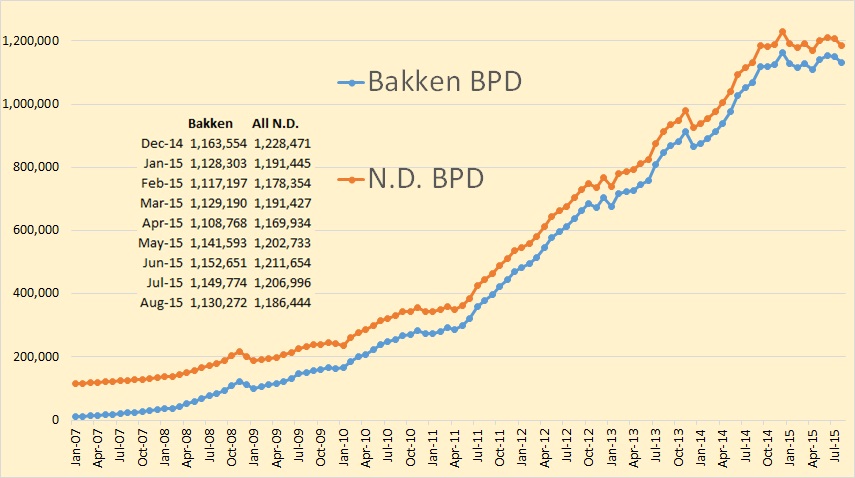
North Dakota publishes Historical Oil Production by County. However confidential wells are not included in these totals. But they also publish a State Summary Report which does include confidential well data for the previous two months. Working with both we can get a pretty good estimate of production from each county.

McKenzie

McKenzie had  a 12,533 bp/d gain in March but they are still 32,447 below their December high.

Read More