International Rig Count Still Falling

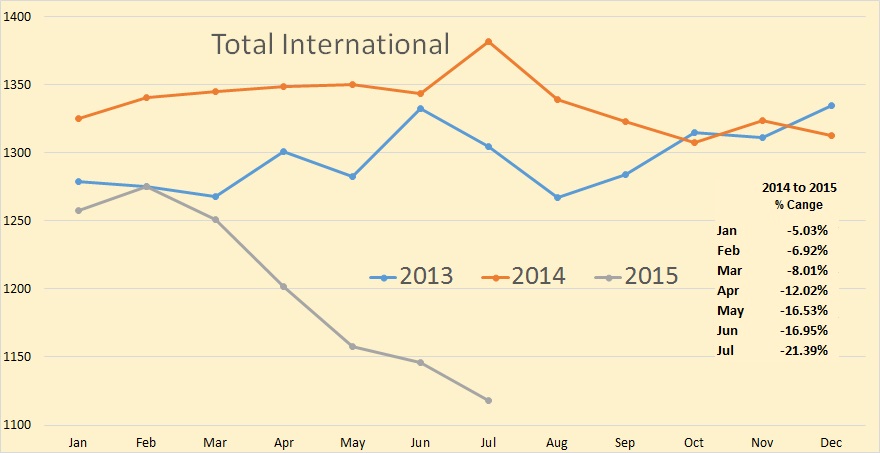
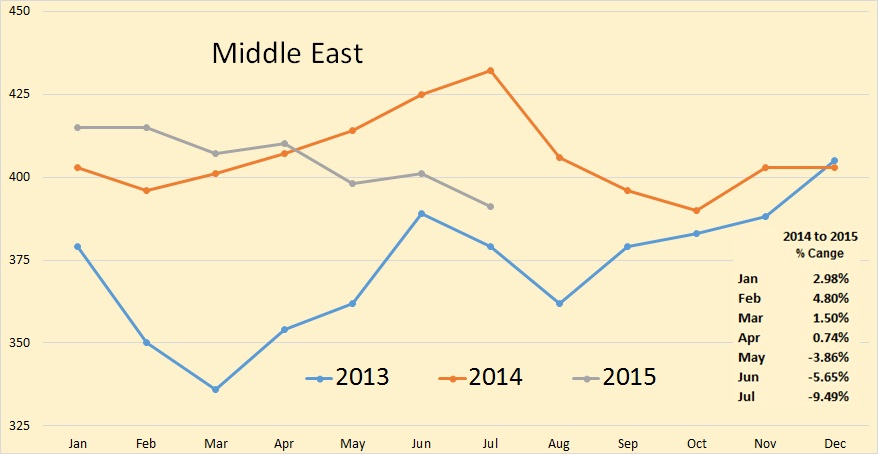
The Baker Hughes International Rig Count is out. I have decided to try something new with the charts. That is to compare the current year’s rig count with the previous two years count and to insert, within the charts, the percent change for this year as compared to last year. Also, this is the total rig count, Oil and Gas. Also the charts are not zero based. I do this in order to better emphasize the monthly change.

July usually sees a big jump in rig counts. This year there was a very tiny July increase, only a fraction of the increase we usually see for July.

Rig Count Total International

*The Total International rig counts does not include the USA, Canada or the FSU. The Total International rig count was down 28 in July to 1118. Last July it was up3 to 1344.
Rig Count Middle East
Read More

US Oil Production Finally Starting to Decline

There has been very little data to post about recently and as everyone should know by now, I post primarily about data. So if there is no data there is not much to post about. Also I have been very busy for the a week now and have checked in only a couple of times.

A few days ago a very racist post was posted on this blog. I completely overlooked it as I seldom scan the posts because I get an email for every post so I just read the posts in the emails. But when there is a guest post, as the one last week was, I get no emails, the guest poster gets them instead. Anyway I deleted the post and banned the poster. I also banned another poster because he accused me of deliberately letting the post stay up. That outraged me. It was the same thing as accusing me of such racism.

Read More

World Natural Gas Shock Model

This is a guest post by Dennis Coyne.

The views expressed in the post are those of Dennis Coyne and do not necessarily reflect the views of Ron Patterson.

The post that follows relies heavily on the work of Paul Pukite (aka Webhubbletelescope), Jean Laherrere, and Steve Mohr. Any mistakes are my responsibility.

For World Natural Gas URR Steve Mohr estimates 3 cases, with case 2 being his best estimate.

Case 1 URR= 14,000 TCF (trillion cubic feet)
Case 2 URR= 18,000 TCF
Case 3 URR= 27,000 TCF

Jean Laherrere’s most recent World natural gas URR estimate is close to Steve Mohr’s Case 1 at 13,000 TCF.

A Hubbert Linearization(HL) of World Conventional Natural Gas from 1999 to 2014 suggests a URR of 11,000 TCF, an HL from 1982-1998 points to a URR of 6000 TCF for conventional natural gas.

Note that “Conventional” natural gas subtracts US shale gas and US coal bed methane (CBM) from gross output minus reinjected gas for the World.

Read More

Texas RRC Oil & Gas Production

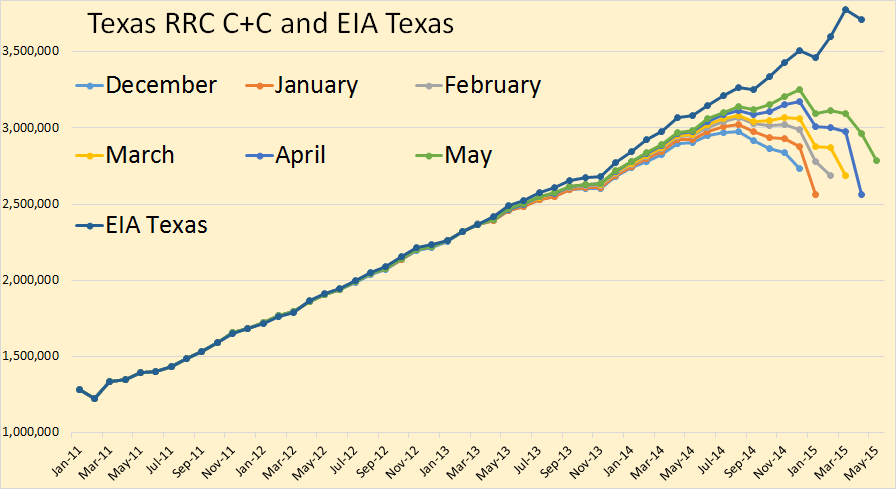
The Texas RRC Data is out. All RRC data below is through May. The EIA data is through April.

Texas C+C

There appears to be an increase in Texas May crude oil production. You will notice that the EIA has departed from their usual practice of just estimating Texas C+C production up about 50,000 bpd for every month for the last six months or so. They have a new method or estimating Texas production which is explained in the first link below the charts.

Read More

Oil Shipments by Rail Declining

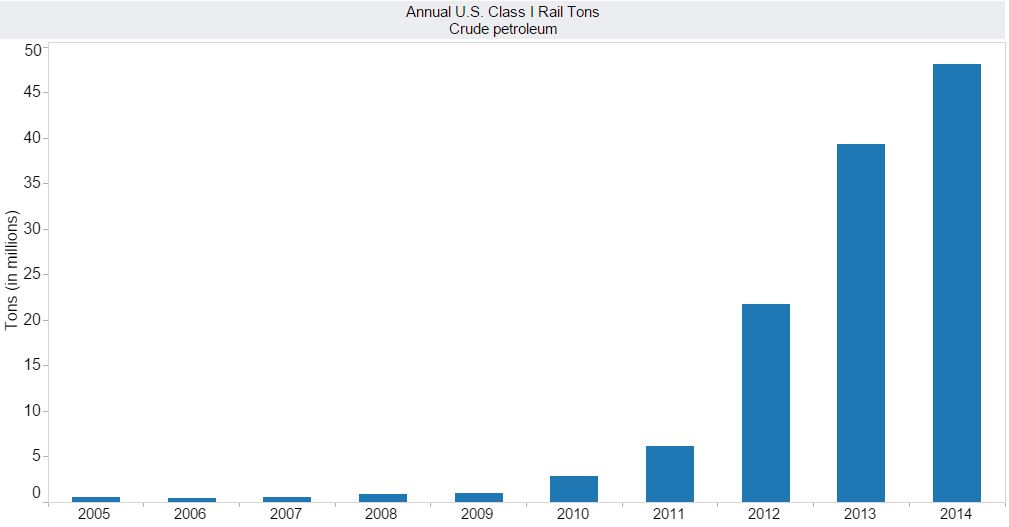
Weekly oil shipments by rail can be found on the web at Weekly Carload Reports. And a summation of that data with charts can be found at Association of American Railroads  Freight Rail Traffic Data.

Rail Oil Carloads 3

Crude oil by rail basically started with the shale boom. Prior to that almost all oil was shipped by pipeline. Of course a lot of oil was trucked to the pipelines. The EIA says in the first seven months of 2014 8 percent of all us crude and refined products was shipped by rail. It looks like that percentage was increased somewhat in the second half of 2014.

Read More