Comments not related to oil and natural gas in this thread please.
OPEC April Production Data
All data below is based on the latest OPEC Monthly Oil Market Report.
All data is through April 2017 and is in thousand barrels per day.

Looking at the above chart it seems obvious what most OPEC nations were doing. They announced in the summer of 2016 that there would likely be quota cuts beginning in 2017. And those cuts would be a percentage of their current production. So everyone began making heroic attempts to increase production by the end of 2016. So now, after everyone who felt that they should cut, has cut, they are right back to the level that they were at before the cuts were proposed.
I wrote the above paragraph last month. I see no reason to change a word of it now.
Open Thread Non-Petroleum, May 15, 2017
Please place all non-petroleum posts in this thread.
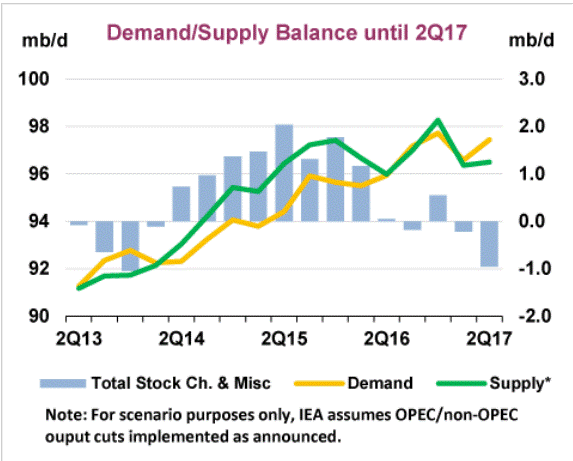
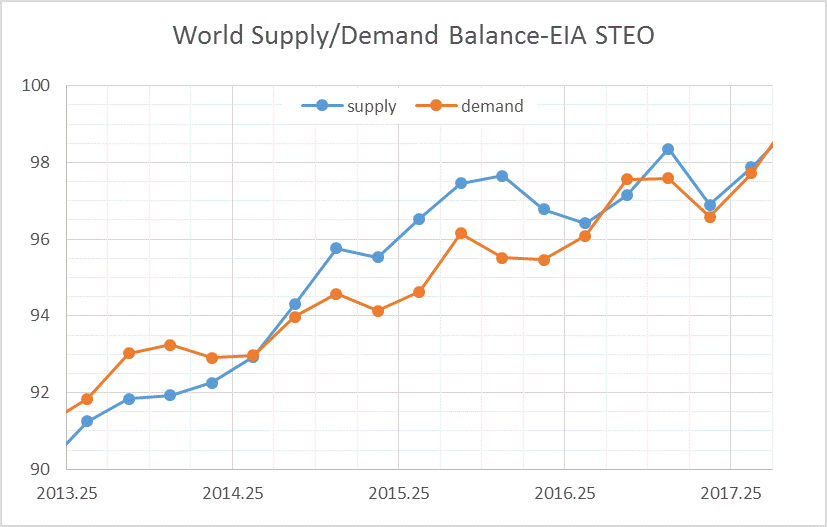
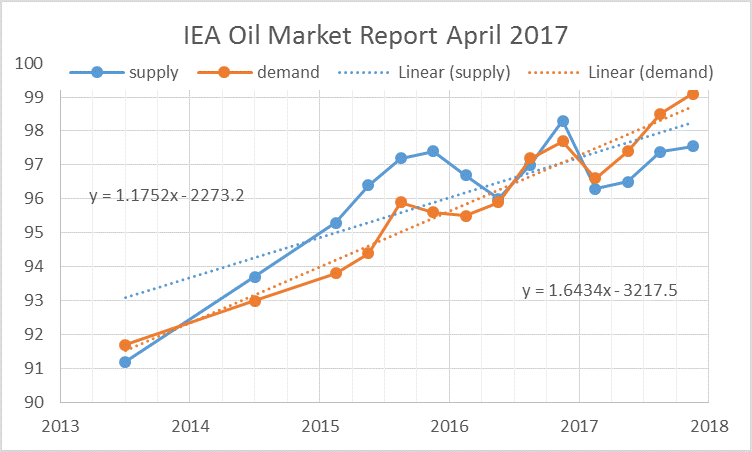
EIA Short Term Energy Outlook (STEO) and IEA Oil Market Report

The IEA Oil Market Report was published in mid April, data from the report can be found here.

The EIA’s STEO was published on May 9, 2017.

I assume in the chart above that OPEC crude output is 32 Mb/d in the last three quarters of 2017. Read More
Open Thread Non- Petroleum, May 9, 2017
Comments not related to petroleum in this thread please.
I am having difficulty coming up with posts, I could use some help with posts, either petroleum or non-petroleum.
Contact me at peakoilbarrel@gmail.com with your idea, before you spend a lot of time writing something up. Or you can write something and e-mail it in a Word document form. Thanks in advance for any help.