This thread is for oil and natural gas related comments.
Non Petroleum comments should be in the other thread.
This thread is for oil and natural gas related comments.
Non Petroleum comments should be in the other thread.
Any comments not related to petroleum (politics, renewable energy, or coal for example) should be in this thread, there will be a separate Open thread for Petroleum (oil and natural gas) discussion.
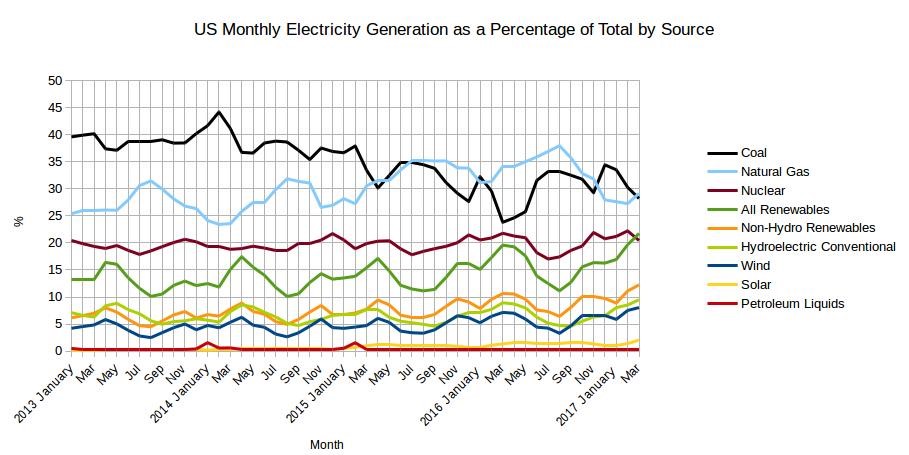

The EIA released the latest edition of their Electric Power Monthly on May 25th, with data for March 2017. March data includes some milestones which are significant in that these circumstances have not existed for a very long time, if ever. Read More
The EIA recently updated its International Petroleum statistics. World Crude plus Condensate (C+C) output was 80,577 kb/d in Feb 2017 an increase of 72 kb/d from the previous month, this was 1695 kb/d below the monthly peak output of 82,273 kb/d in November 2016. The most recent 12 month average (centered on August/September 2016) was 80,501 kb/d, 3 kb/d less than the previous most recent 12 month’s output. The 12 month centered average peak output was 80,574 kb/d in June/July 2016 as previously predicted by Ron Patterson and currently the 12 month average output is 73 kb/d below the peak. Read More
Comments not directly related to oil and natural gas in this thread please.
The Chart above compares several different combinations of past (vintage) data to estimate output. The dotted line is based on the most recent 8 months (August 2016 to March 2017) of data saved from the RRC website, the blue solid line is based on the past 12 months of data, and the yellow line is based on the most recent 3 months of data. Read More