Comments not related to oil and natural gas in this thread please.
GoM June Production Update
A Guest Post by George Kaplan
Production
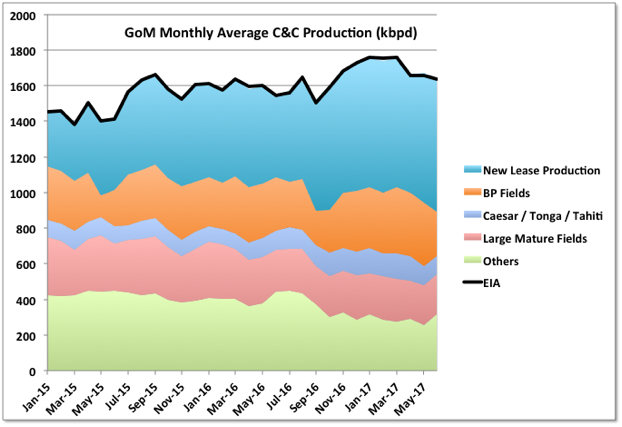
Production for June by BOEM was 1631 kbpd and by EIA 1636, compared with 1673 and 1659 kbpd, respectively, in May. The decline was mostly from Thunder Horse going offline and Constitution staying offline. Hurricane Cindy didn’t seem to have much of an impact, things will be different for the impact of Harvey on August figures.
Even with the two offline facilities coming back July numbers will struggle to beat those for March, and after that the depletion declines and hurricane disruptions take over. Note that the “others” area includes any assumptions BOEM has made to allow for missing data, which is quite a lot this month.
Open Thread Non-Petroleum, September 6, 2017
Comments not related to oil and natural gas in this thread please.
Norway Oil and Gas: Reserves, Production and Future Projection
A guest post by George Kaplan
Norwegian oil production peaked in 2000 to 2001; gas production may be peaking about now. Oil hit a low in 2013 and then recovered towards a new local peak, probably concurrent with the gas.
Drilling and Development
The most surprising thing I find with their industry is that the drop in oil price made almost no difference the drilling activity shown here (all data here and below taken from the NPD – Norwegian Petroleum Directorate – which provides more data than just about any other such organisation).
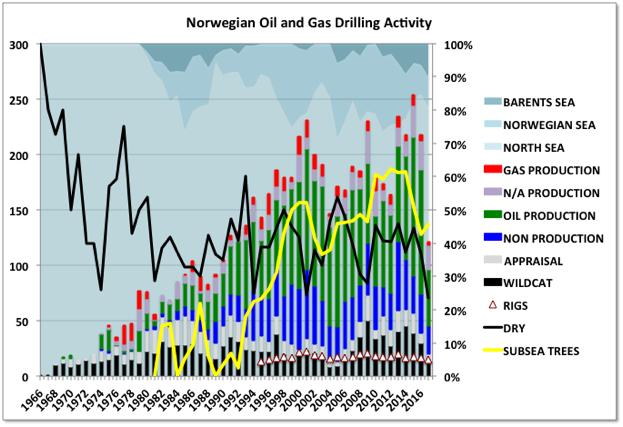
The chart shows numbers of wells drilled, as stacked bars, and number of operating rigs (unstacked) against the left hand axis, other curves are ratios of total against the right axis. Read More
EIA’s Electric Power Monthly – August 2017 Edition with data for June
A Guest Post by Islandboy
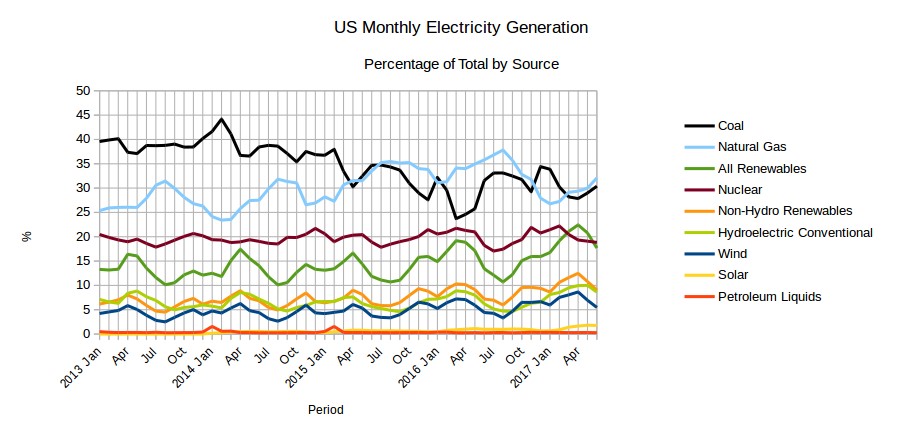
The EIA released the latest edition of their Electric Power Monthly on August 24th, with data for June 2017. With all the data for the first half of 2017 now available the half year performance of the various sectors can be assessed. As reported on the web site utilitydive.com “Coal tops gas as leading generation source in first half of 2017“. PV Magazine on their news web page chose to highlight that, “Renewables generate (almost) as much U.S. power as nuclear during H1 2017“. The highlights of the first half of 2017 include (See the YTD row of Table 2 below for data):
• Coal generated slightly more than Natural Gas
• Nuclear generated slightly more than All Renewables
• Conventional hydro generated slightly more than Wind and Solar combined
• Non-Hydro Renewables generated more than conventional hydroelectric
• Carbon neutral and zero emission sources combined generated more than either gas or coal Read More