General discussion here.
GoM: First Quarter 2018, Production Summary
A Guest Post by George Kaplan
Crude and Condensate
BOEM has March 2018 production at 1696 kbpd, which is down 1% month-on-month and 4% year-on-year (March 2017 was the peak production month for GoM so far). EIA numbers were very similar, although last month’s were higher and haven’t been revised yet – typically EIA numbers end up almost exactly corresponding to the BOEM reported total qualified lease production, whereas BOEM can be a little higher, maybe including test wells or non-qualified leases.
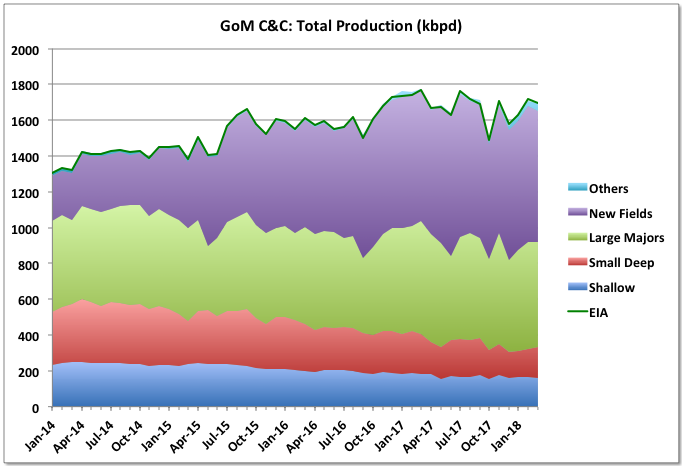
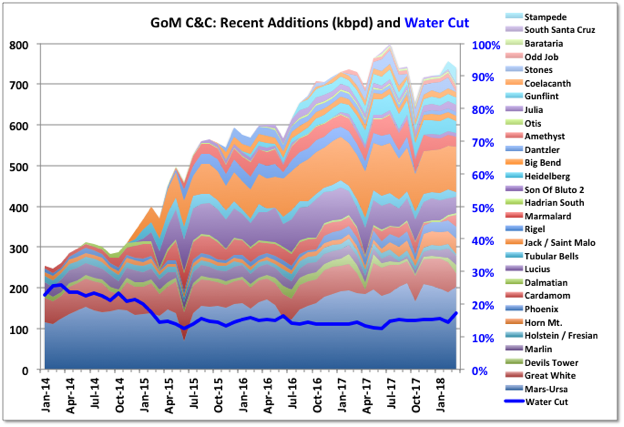
The major new project, Stampede, started in January, has no reported production numbers yet. BOEM and EIA estimate non-reported values and then retrospectively adjust their reports when actual numbers are available. I don’t know how they estimate new production but Stampede could produce around 60 kbpd with current plans, though likely a lot less initially as only one of two leases has been ramping up. I’ve assumed 20 and 40 kbpd for February and March respectively, which still might be high. Even allowing for that, and assuming other late numbers are the same as the previous month, since December EIA and BOEM both have estimates about 30 to 40 kbpd higher than the reported lease and well production numbers (which always match closely) would suggest. Usually the difference is no more than ten. It is unlikely that the other late numbers, of which there are few, and none for all four months, will show such large, sudden and unexplained increases so either I’m missing something (maybe a lease not yet included in the numbers, but also not reported as starting up) or there could be some future downward adjustments.
Rigel and Otis are still off-line following the failure at a subsea manifold last October and are taking out about 22 kbpd plus some gas (Otis is a small gas field). Great White, Stones (for the full month) and Caesar/Tonga all had noticeable downtime in March taking about 90 kbpd off-stream.
EIA’s Electric Power Monthly – May 2018 Edition with data for March
A Guest Post by Islandboy
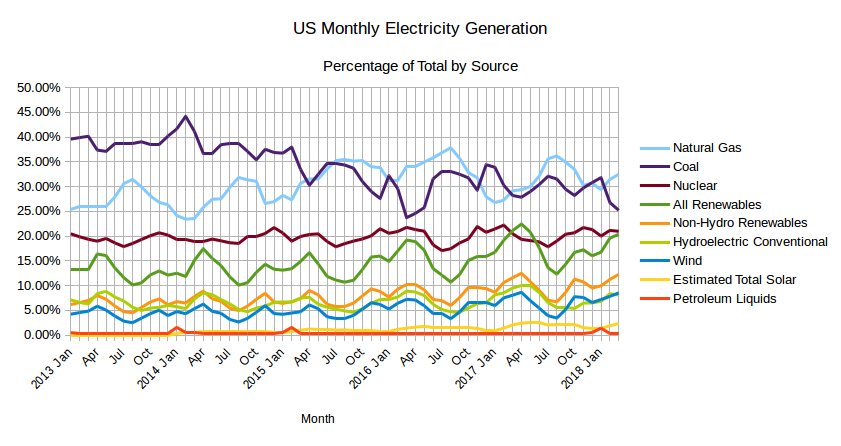
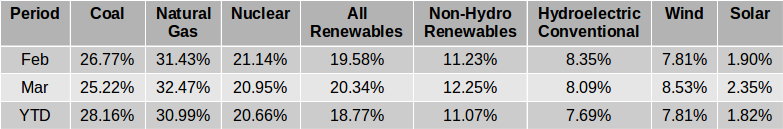
The EIA released the latest edition of their Electric Power Monthly on May 24th, with data for March 2018. The table above shows the percentage contribution of the main fuel sources to two decimal places for the last two months. Read More
OPEC May Oil Production
All OPEC data below is from the OPEC Monthly Oil Market Report. All OPEC data is in thousand barrels per day and is through May 2018.
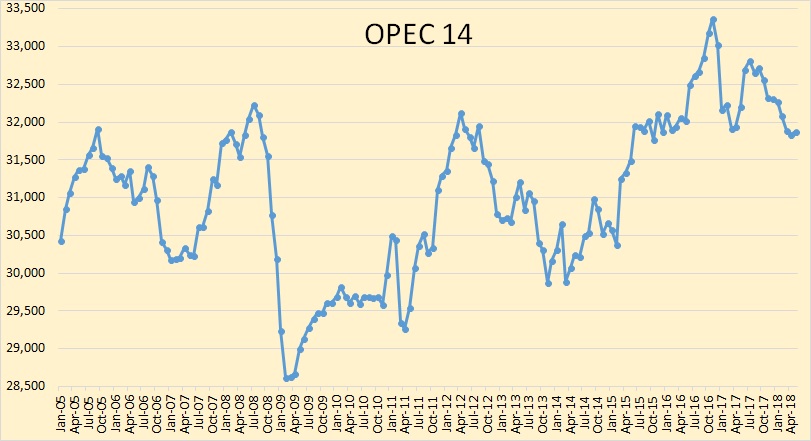
OPEC 14 Crude oil production was up 35,000 barrels per day but that was after March production had been revised down by 32,000 bpd and April production was revised down by 89,000 bpd.
Open Thread Non-Petroleum, June 12, 2018
Comments not related to oil and gas go in this thread please.