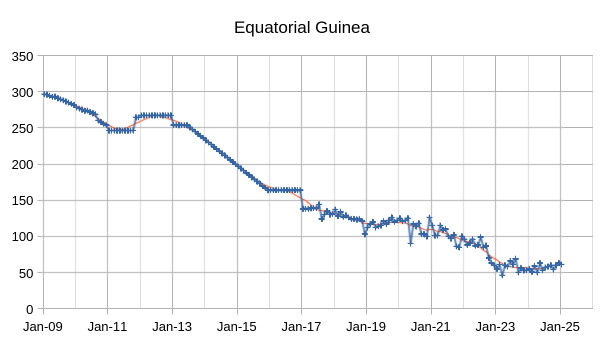
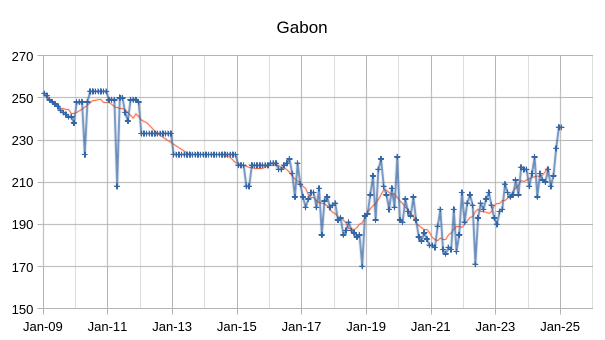
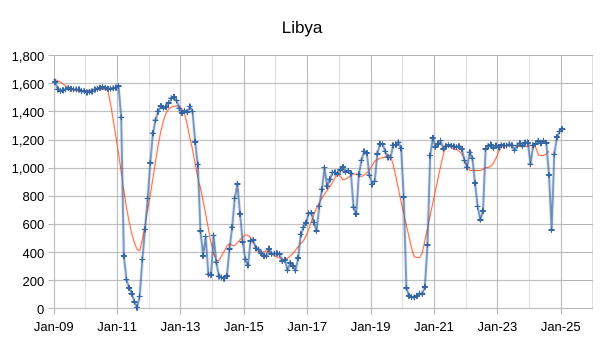
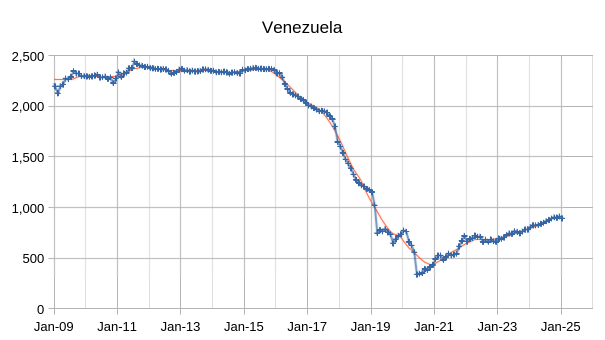
The OPEC Monthly Oil Market Report (MOMR) for February 2025 was published recently. The last month reported in most of the OPEC charts that follow is January 2025 and output reported for OPEC nations is crude oil output in thousands of barrels per day (kb/d). In the OPEC charts below the blue line with markers is monthly output and the thin red line is the centered twelve month average (CTMA) output.
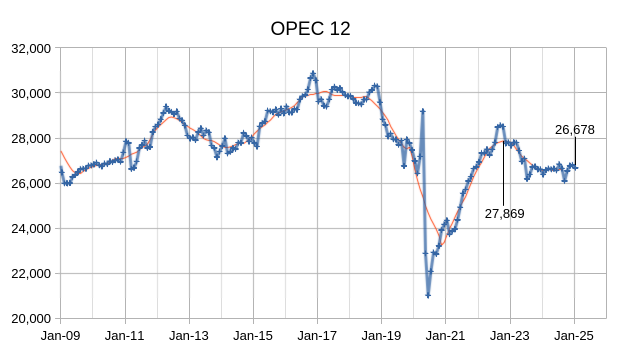
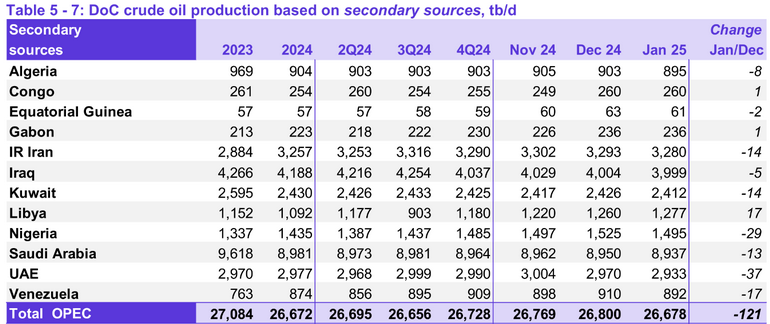
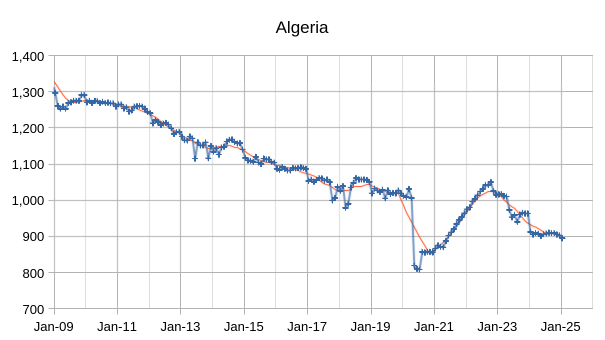
Output for December 2024 was revised higher by 59kb/d and November 2024 output was revised higher by 54 kb/d compared to last month’s report. OPEC 12 output decreased by 121 kb/d with the largest decreases from UAE (37 kb/d), Nigeria (29 kb/d), and Venezuela (17 kb/d). Libya saw an increase of 17 kb/d and most other OPEC members had small decreases of 14 kb/d or less.

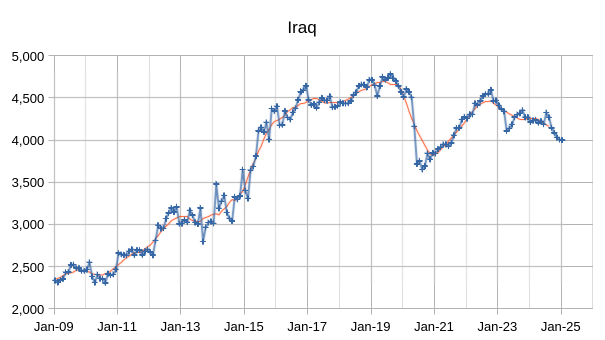
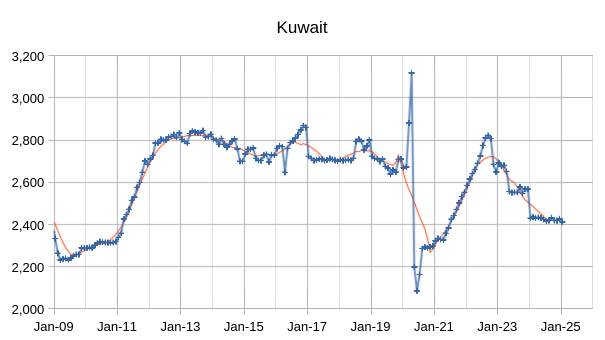

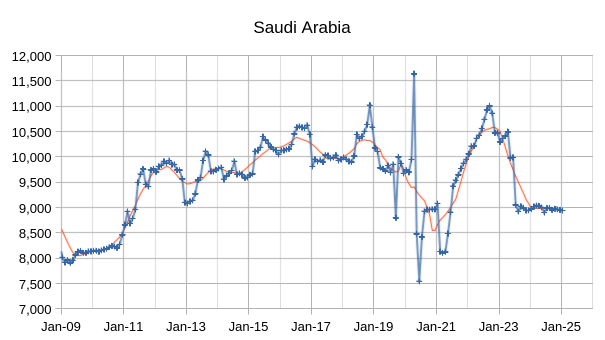
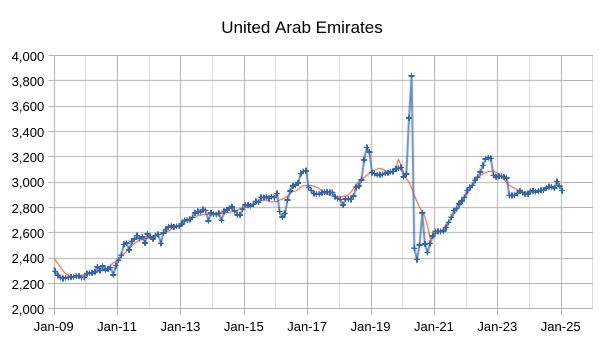
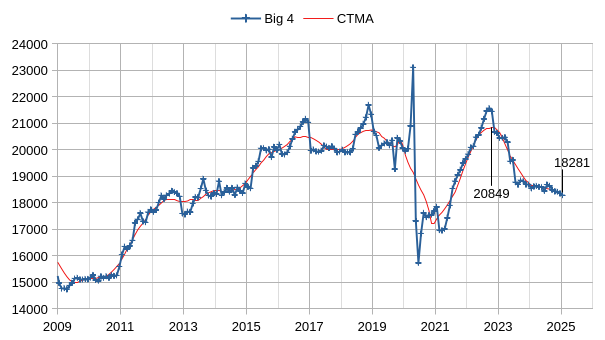
The chart above shows output from the Big 4 OPEC producers that are subject to output quotas (Saudi Arabia, UAE, Iraq, and Kuwait.) After the pandemic, Big 4 average output peaked in 2022 at a centered 12 month average (CTMA) of 20849 kb/d, crude output has been cut by 2568 kb/d relative to the 2022 CTMA peak to 18281 kb/d in January 2025. The Big 4 may have roughly 2568 kb/d of spare capacity when World demand calls for an increase in output.
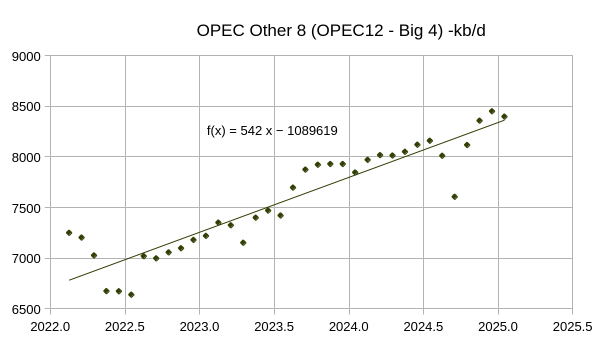
Most of the increase in the Other 8 OPEC nations (those OPEC 12 nations that are not part of the Big 4) came from Iran and Venezuela (about 434 of the 542 kb/d average annual increase), with the remaining 6 nations (all except Libya were subject to quotas) having relatively flat output over the 36 month period covered in the chart above (February 2022 to January 2025) . See chart below for OPEC Other 6 (OPEC 12 minus Big 4 minus Iran minus Venezuela) with an average annual increase of only 108 kb/d over past 3 years.

The increase in Iran and Venezuela’s crude output has been slowing lately so I expect OPEC other 8 output to slow to an annual rate of 200 to 300 kb/d over the next 36 months (2025 to 2027).
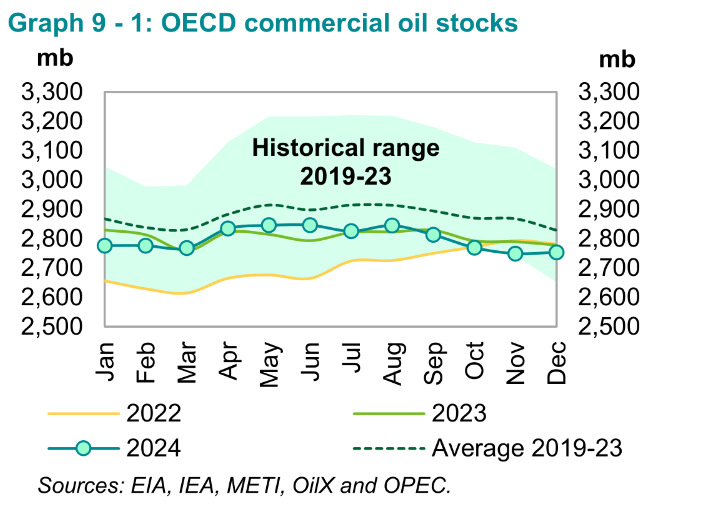
OECD Commercial Petroleum Stocks remain near the bottom of the 5 year range and oil prices continue to be low.
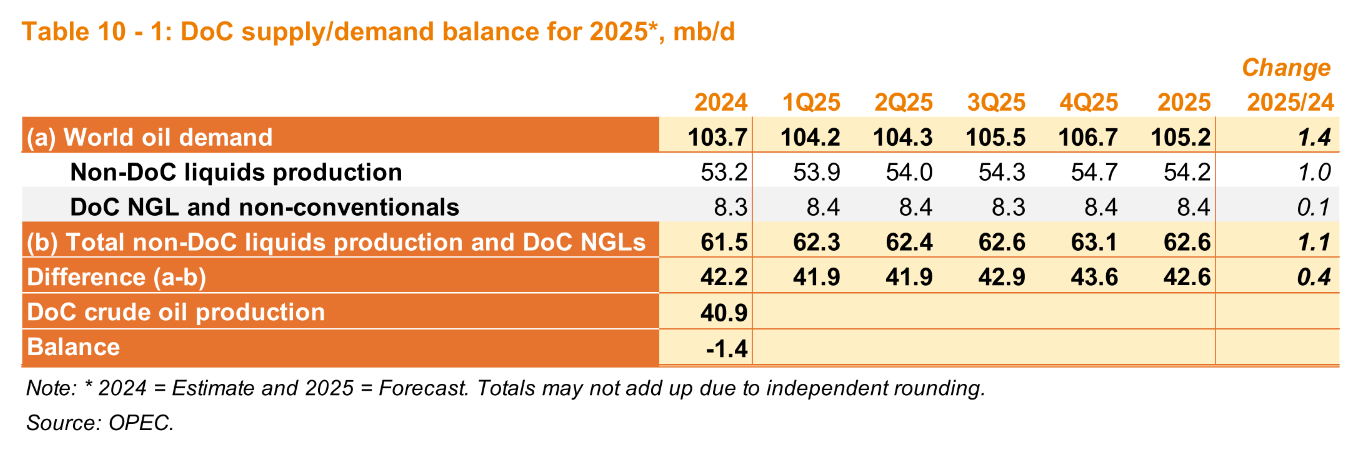
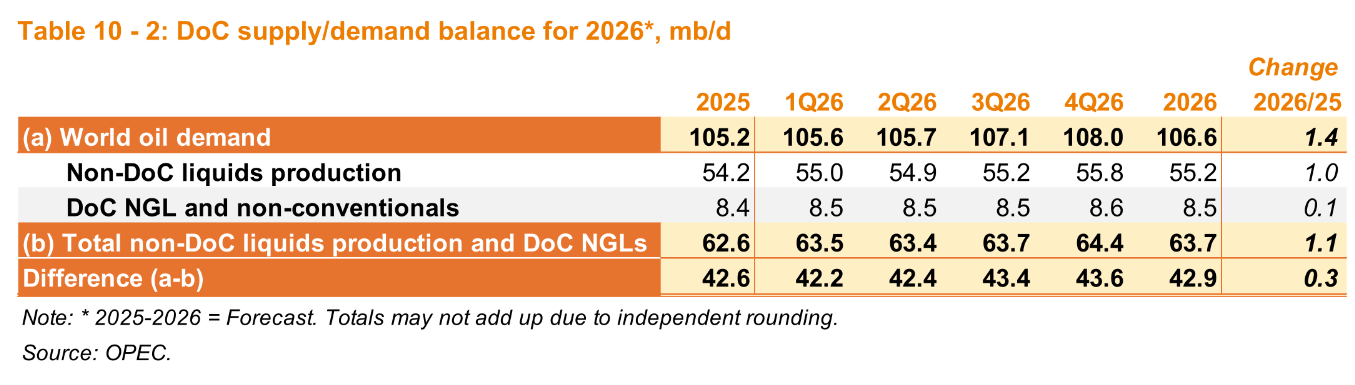
World liquids demand is unchanged from the January MOMR, but non-DOC liquids output in 2025 was revised lower by 0.1 Mb/d and in 2026 was also revised lower by 0.2 Mb/d compared to last month’s report.
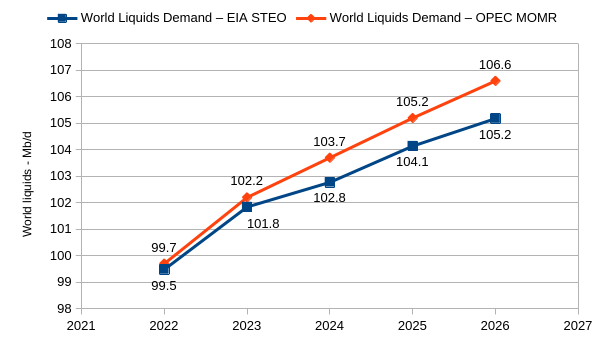
OPEC has a significantly higher World liquids demand estimate than the EIA in 2024 to 2026 as shown in the chart above. I expect the EIA estimate will be closer to reality.
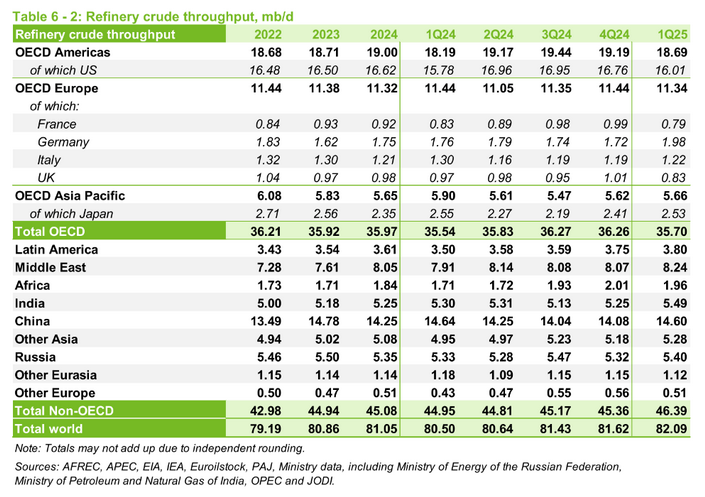
Peak annual refinery throughput was in 2018 at 81.7 Mb/d, for the past 4 quarters average throughput has been 81.45 Mb/d, close to the peak level.
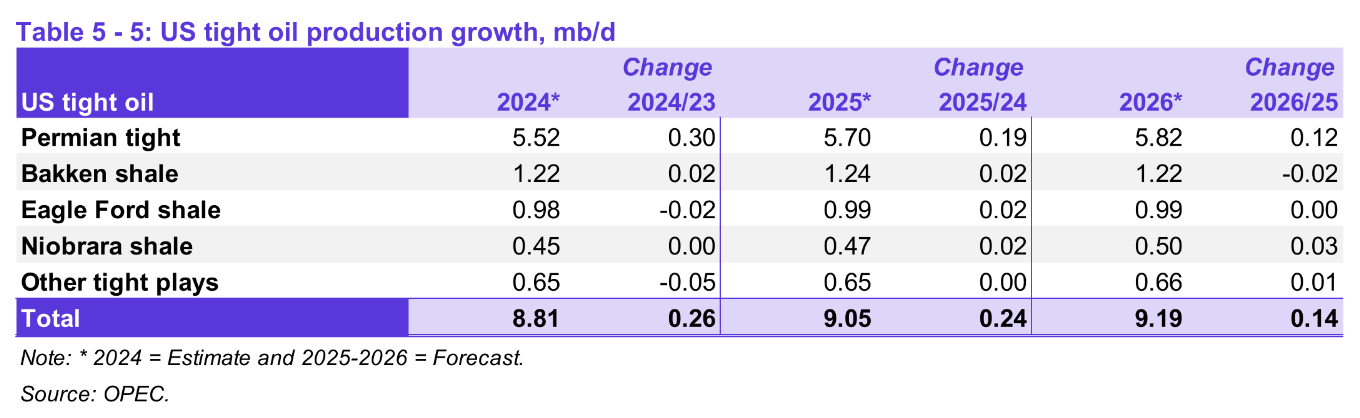
The OPEC estimate for US tight oil in 2024 was revised 10 kb/d higher than last month’s estimate, 2025 tight oil output was revised lower by 40 kb/d and 2026 tight oil output was revised lower by 90 kb/d.
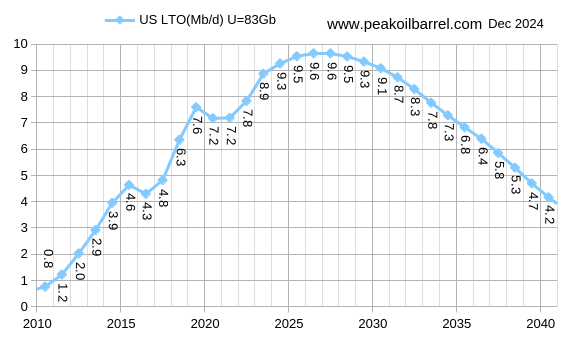
The scenario/estimate above is unchanged from last month’s update, my estimate for 2024 tight oil output is 490 kb/d higher than the OPEC estimate, 2025 is 450 kb/d higher and 2026 is 410 kb/d higher. This difference i 2024 is likely due to OPEC not including all of the tight oil formations in the Permian basin in the estimate for 2024, the EIA tight oil estimates suffer from the same problem.
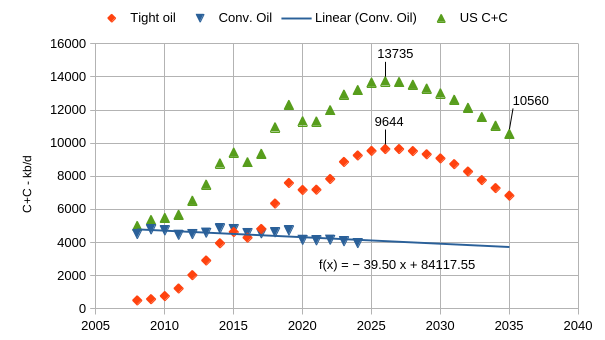
The chart above uses the tight oil scenario from the previous chart (and reproduced in red in the chart above) and US C+C production minus tight oil output (aka conventional C+C) from 2008 to 2024 to forecast future US conventional output using the ordinary least squares (OLS) trend from 2008 to 2024 to forecast US conventional output from 2025 to 2035. This conventional forecast is then added to my tight oil forecast to create a forecast for US C+C output from 2025 to 2035 (in green triangles in the chart above). The peak is in 2026 at 13725 kb/d which is similar to the EIA STEO forecast from Feb 2025.
This is of concern as about 69% of the increase in World C+C output from 2008 to 2019 came from the US increase in C+C output (with about 95% or more of this increase from tight oil). From 2022 to 2026 about 80% of the increase in World C+C output came from the US increase in C+C output. If the above forecast proves accurate, I expect World output will peak by 2028.
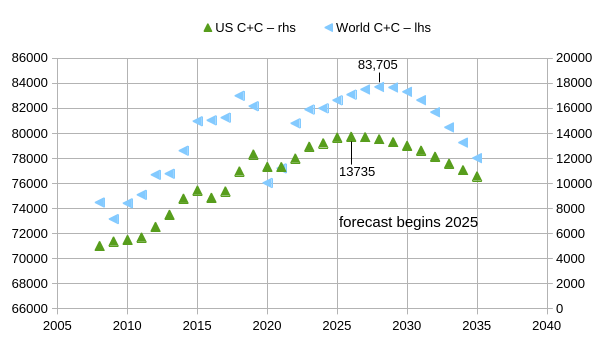
The chart above compares my World C+C forecast from 2025 to 2035 using the Oil Shock Model (read output from left vertical axis) with the US C+C forecast presented in the previous chart and reproduced in green above (use the right vertical axis for US C+C). Note that the magnitude of the left and right vertical axes from minimum to maximum are the same (20,000 kb/d in each case) and the units on the vertical axes is kb/d. Increases in OPEC output as well as increases Canada, Brazil, and Guyana’s C+C output allows World C+C to continue increasing in 2027 and 2028.
I will take the opportunity of being the first to post to thank you for this work. So much time and energy invested, thank you Dennis. It remains exciting to see how everything turns out. Peak oil is still the elephant in the room that nobody seems to see …
Great Work Dennis!
https://www.reuters.com/business/energy/guyana-soon-sign-oil-agreement-with-totalenergies-led-group-2025-02-20/
Guyana to sign agreement with French TotalEnergies
Thank you Westtexasfanclub and Andre the Giant.
https://www.yahoo.com/news/trump-cuts-financial-lifeline-venezuelas-212346181.html
Trump removes Chevron’s ability to export Venezuelan oil to USA.
Scaring off Canada and Venezuela might no be best strategy if Permian gets big decline.
It’s funny, though, so I’m all for it.
I wonder if Trump is trying to punish Californial
https://www.energy.ca.gov/data-reports/energy-almanac/californias-petroleum-market/annual-oil-supply-sources-california
Putin wants California to secede from the union, so probably.
Russian spooks have been training Republicans to badmouth California for decades, and it has worked well.
Scaring off Canada and Venezuela might no be best strategy if Permian gets big decline.
Trump wants to revive the Keystone pipeline. In an unrelated move, he is slapping a 25% tariff on all Canadians goods and services.
This is a guy who paid a porn star $125,000 (and another $125,000 to his lawyer to cover the tax bill) for a quicky, so don’t expect any high precision strategies.
From 2022 to 2026 about 80% of the increase in World C+C output came from the US increase in C+C output
Dennis
Should that read 2020 to 2024?
Loads of oil,
I am using my forecast for World and US C plus C for 2025 and 2026, see chart below. The US increase in C plus C over the 2022-2026 period was about 79% of the World total using the ratio of the trends (421/533=79%). I drop 2020 and 2021 as they are anomalous due to pandemic and recovery.
Dennis
What confused me, is you using the past tense in the statement. US oil production may increase by 0.5 mmb/d.
Where are you getting the other figures for future crude production, OPEC mainly uses total liquids.
Loadsofoil,
I agree I wrote that poorly, should have used future or conditional tense rather than past tense.
I guess at future output using the Oil shock model. There are three scenarios combined tight oil (US only), World Extra Heavy Oil (XH), and World C plus C less US tight less World XH Oil, the 2025 and 2026 forecast is based on my most recent World Oil Shock model from December 2024. Read tight oil and extra heavy oil (Canadian Oil Sands and Venezuela Orinoco Belt) from left vertical axis and C plus C minus LTO minus XH from right vertical axis. World C plus C is the sum of the three scenarios.
Loads of Oil
In the last World update the attached chart was posted. It shows World oil production without the U.S. The post pandemic peak was reached in February 2023. In March 2023 OPEC announced it was cutting production by 1,700 kb/d. By August production dropped back by 2,000 kb/d to 68,000 kb/d. The rise after that was largely due to the US plus Brazil and Guyana. The subsequent drop is mostly Non-OPEC countries and a slow response from Russia to meet its cutback commitment.
The increase in the red graph may be anticipation that OPEC will bring back production.
I think that with US production slowing, Non-OPEC production will be entering its plateau phase in a year or two.
Note also that my forecast for World C plus C output in 2025 and 2026 is 82.6 and 83.1 Mb/d respectively. The STEO forecast from Feb 2025 had output at 83.2 Mb/d in 2025 and 84.5 Mb/d in 2026 (annual average output) for World C plus C (600 kb/d higher than my forecast in 2025 and 1400 kb/d higher in 2026.) I think the EIA estimates are too high, but often my forecasts are conservative, reality may fall between my forecast and that of the EIA, or it may not.
Dennis
I agree, I think the 2018 peak will be exceeded by 2026 or 2027 at latest and last for only a few years. After that, oil prices will start to rise.
Countries with extensive electrical grids and the ones able to increase generation rapidly will be able to adjust. It will still be difficult as the sale of electric cars are far below what is needed. Also trucks use a large portion of road fuels and we are far behind the curve in terms of research and development of alternatives and the massive infrastructure changes required.
https://www.fleetnews.co.uk/news/truck-news/2023/09/08/new-hydrogen-powered-hgv-could-be-on-the-road-by-2024
The world has managed to cope with oil production being flat, but oil production falling by 2% or so each year is going to be very different. The relentless decline of this commodity, one barrel of which delivers as much energy as a man working all year will impact all areas.
If oil decline were the only problem, it would be bad enough. However fresh water depletion and rainfall failure are requiring the building of hundreds of desalination plants. They are being built all over the world and are taking up vast amounts of energy needed for other things.
https://thesourcemagazine.org/striving-for-desalinations-gold-sustainability-standard/
Ignorant people talk casually about easy fixes that are neither easy nor cheap.
Global population is not about to peak and the most optimistic prediction has population increasing by another billion before levelling off in 2040. These people will want to consume as much as you in the United States consume. Thinking of another 3 additional United States demand for oil, gas, food and fresh water, even half that will be a monumental task.
Loadsofoil,
Population growth is slowing down in most areas of the World, World C+C consumption per capita has been decreasing since 1980. In the chart below I use Energy Institute refinery throughput data as a measure of World C plus C consumption, other measures include NGL output which is more of a gas than a liquid at standard temperature and pressure. I agree a transition may not be without difficulty, China and Norway have made great progress in converting passenger vehicles to battery power, many other nations may follow their lead.
“building of hundreds of desalination plants”
And all the salt goes into landfills. That would be 12 pounds of salt disposed of per barrel of ocean water processed.
Apparently no rivers in Saudi Arabia, so all the salt that goes into a landfill will never leach out and go somewhere else, which may explain why SA is one of the leaders in desalinization. Yet they have no problems with screwing up Aridzona.
https://www.agdaily.com/crops/arizona-sues-saudi-owned-fondomonte-llc-over-groundwater-use/
Dennis
Why has oil consumption gone up by 30 million barrels per day then?
Agree Loads of Oil.
A rational person/country will have asked themselves starting 3 or 4 decades back-
‘How can I get by with a lot less oil?’
Who beside China seems to take that challenge seriously?
Although your comment about desalinization can be applied to many other applications
“are taking up vast amounts of energy needed for other things.”
When we are talking about oil I say that applies especially to light transportation…oil is far too valuable to be used for light transport, which is something like 60% of the use.
Also, air travel. A completely optional waste of oil.
Ovi
Thanks. So Do you agree with Dennis that global production will peak around 2028 or so.
Loads of Oil
Yes I do. 2028 ± 1 yr.
OVI, you are kidding, right?
So the peak oil is reached because China has found viable alternative energy, including coal, not because of oil running out?
Natural gas scenario below for US uses HL for US conventional wet natural gas to get a URR of 1460 TCF, for shale gas I use the USGS mean TRR estimate and assume about 67% will be economically recoverable (can be produced profitably) which leads to a URR estimate for shale gas of about 1540 TCF, the total wet natural gas (aka marketed natural gas in EIA statistics) URR is 3000 TCF for the United States.
The scenario below assumes no new LNG export terminals are approved after 2025Q1 and that all projects that have received approval will be built. Peak output is 124 BCF/d for dry natural gas and 135 BCF/d for marketed natural gas (before NGPL is removed at processing plants) and occurs in 2029.
The scenario assumes another 20 BCF/d of LNG export capacity is added to existing capacity of about 12 BCF/d (most recent 12 month average for LNG exports from the US). In 2029 it is assumed that 32 BCF/d of LNG is exported and about 9 BCF/d of natural gas is exported by pipeline for a total of 41 BCF/d of natural gas exports in 2029. If we assume natural gas imports of 8 BCF/d (as in 2023) then net exports are 33 BCF/d leaving 91 BCF/d for US consumers of natural gas in 2029.
Note that in 2023 about 89 BCF/d of marketed natural gas was consumed in the US, about 80 BCF/d of natural gas was delivered to consumers, unfortunately in the consumption numbers they don’t break out dry gas from marketed gas. About 21 BCF/d of natural gas was exported in 2023 out of 104BCF/d of dry natural gas production, there were also 8 BCF/d of natural gas imports so net exports were about 13 BCF/d, this suggests about 91 BCF/d of dry natural gas consumption in 2023 (similar to the earlier forecast for 2029).
the shale gas TRR numbers by USGS has been conservative,
local level USGS gives higher estimate, Boswell2021 gives Base uTRR of 873TCF and 725TCF, for Marcellus and Utica respectively. Obviously, right now Utica is too costly to develop, but that’s because of the pipeline issues, which brought down the wellhead price just above $1. If pipelines to NewEngland and other LNG terminals and AI data centers are built, the extra $1 price will be realized and Utica will be economic, i.e. replacing the import and power data centers.
Like wise, EF and Haynesville dry gas also have similar price discount issues like Utica, mainly export bottlenecks.
There is also the Marcellus shale gas estimate done by Saputra (Hughes, Patzek group) 2024AAPG, which only gives 180TCF URR, probably lower than USGS national level numbers. If you look at the production type curve of past years their paper used, they are obviously off from NOVI data plots, especially for the core.
Sheng wu,
I don’t think the most optimistic estimates are necessarily correct.
The methodology the USGS has used for shale gas and tight oil has remained consistent since 2013, many oil professionals have claimed the mean TRR estimates by the USGS are far too optimistic. For North Dakota Bakken/Three Forks tight oil the mean TRR estimate is about 12 Gb, my modelling suggests about 8 Gb for the eventual ERR, this is may basis for a URR that is 67% of the mean TRR estimate. Time will tell how accurate this estimate proves to be.
Pipeline access to New England needs to go through New York State, so far that state has blocked access, so the problem may never be resolved, New England should focus on Wind, Solar, Nuclear, and Batteries with perhaps some biofuel backup. I have mean USGS TRR for all US shale and coalbed gas plays at about 2300 TCF, multiply by 67% to get URR of 1540 TCF with conventional natural gas TRR=1460 TCF for a total of 3000 TCF for my scenario.
Dennis,
Agree USGS estimate for tight/shale oil has been a little bit over optimistic.
Factors contribute to the discrepancy, i.e. over optimistic for tight/shale oil and underestimate for shale gas,
The past decline curves for conventional don’t work for tight/shale oil and shale gas, and each basin/formation have drastically different decline curves and with different production protocols.
Even new type curves developed after new fracing technology can not fit all and longer history. Patzek developed a curve for shale gas for Barnett, which should be easier than shale/tight oil, and and obviously Marcellus and Haynesville deviate from his type curve. Even Barnett refracing practice, which is not considered then, also changed his predicted curve. Similarly, tight/shale oil also have drastically different curves for different formations and different completion time/method.
Diving into more details, seems that shale oils and Haynesville shale gas have similar behavior, they keeps on getting higher IP, but the decline is also getting worse, resulting no change in EUR per foot if not degradation after 2015 or even after 2013 for Bakken (see work by Frank Male). At the same time, USGS has increased URR estimate for Bakken, probably weighing heavier on higher IP.
But Marcellus shale gas average seems to have EUR per foot also improved along with higher IP, especially comparing prior 2013 to now.
Sheng Wu,
The USGS uses well data for their estimates with recent estimates for Marcellus and Utica in 2019 probably using data for wells completed from 2008 to 2016 to do their type curves, yes there are differences from basin to basin, but the data from the wells reflects this and a scientist adjusts their type curves accordingly. I have done this type of work extensively for the Bakken, Eagle Ford, and Permian basin (especially the latter), I have done very little for the Marcellus or Utica. One unknown is how much productivity decreases outside the core areas, we may find that much of the non-core is not economically recoverable, often the economics is left out of geological analyses. When the core is exhausted we may see a dramatic decrease in average new well productivity. and a large decrease in the completion rate as E and P companies start to lose money on every new well drilled.
Dennis,
you are right the USGS latest 2019 report has old production data, and Boswell 2021 has more latest data — look at the NOVI plot and see how much have been improved from 2013 to 2016, and again from 2016 to 2018 in Marcellus.
Sheng wu,
Note that the Novi data is not mormalized for lateral length so some of the improvement comes from longer laterals and when prices went down in 2016 to 2018 there may have been some high grading where only the best areas are drilled.
I looked at a 2020 Marcellus well and got an EUR of about 16 BCF using Novi data fit to hyperbolic with 12 % annual terminal decline. Using that well profile and assuming average new well productivity starts decreasing at 1%, 2% and 5% per year starting in Jan 2023 with about 528 wells competed per year for 16 years followed by decreasing completion rate to zero after 3.7 years.
Seems my scenario for Marcellus is too low as recent output is about 25 BCFpd. Will adjust scenario.
I realize now this scenario Pennsylvania Marcellus only, I used to have access to state level data from Novilabs, but that is no longer the case.
Dennis,
here are several issues about Marcellus, as well as all shale oil and gas,
1. EUR per well improvements,
The improvements come from several factors as you listed. Lateral length, might contributed 3BCF USGS outdated number to 7BCF increase. But the newer completions also contribute the 7BCF to ~16BCF increase probably, note that this improvement is not realized as much in tight/shale oil, where the IP is higher as well, but decline also much more obvious. Note that the completion improvements, i.e. switching from gel to slick water, and ceramic to sand, more stages, are obvious from 2014 to 2016 for all basins, shale gas and oil, but the further higher intensity later from 2018 to 2020 only contributed higher IP for shale oil and Haynesville, but the decline actually went south for shale/tight oil, about the same for Haynesville, and obviously better for Marcellus. USGS over estimated the URR for shale/tight oil probably only emphasized the higher IP, but did not consider the faster decline, resulting a 33% discount to the URR numbers. While this discount probably is smaller for Haynesville shale gas, and much smaller for Marcellus shale.
2. Spacing, infill & 2nd Tier
The spacing in Marcellus according Boswell2021, is generally below 1,000 ft, some as short as 500ft. The tighter spacing infill is like drilling in the 2nd tier in many cases. With longer lateral and higher fracing intensity, the EUR could be on par with core parent wells for 2nd tier or core infills, if not improvements at even lower cost. This is different from shale/tight oil, where the negative impact of doing infill is much larger.
3. Cost down
Switching from gel to slick water, using local wet sand instead of more expensive sand by rail, frac several laterals on a single pad zipper fracing. The bridge plugs cost also down from $10~20k/ea to $2~3k/ea. These costs reduction enable higher intensity, more stages at lower cost. Thus enabling more infills and 2nd tier to be profitable — but Marcellus obviously benefit more than shale/tight oil.
Updated Marcellus scenario.
Marcellus scenario above has URR=250 TCF, USGS mean TRR is 306 TCF, so URR is about 82% of mean TRR estimate, probably on the optimistic side. Cumulative production reaches 50% of URR in 2028 for this scenario.
Alternative Marcellus scenario with URR=211 TCF.
Here is Appalachian Shale gas (Marcellus plus Utica), cumulative production about 115 TCF. Mean TRR from USGS about 594 TCF, my estimate is 67% of that so about 400 TCF. If this estimate is correct and output increases by 1 TCF per year from 2025 to 2030 then we reach 200 TCF cumulative in 2030 and may be at the peak. If instead we remain on plateau at 12 TCF per year, we reach 50% of URR in 2031, it kind of looks like we are on a plateau for past 4 years or so.
Dennis,
The 67% discount to USGS is based on USGS overestimate of Bakken case?
As the production data (NOVI and Boswell) show USGS have underestimated Marcellus shale gas so far, and Saputra (Hughes, Patzek group) 2024AAPG (180TCF URR) is probably 1/2 of USGS Marcellus. Because Utica production is still minor, I think we should not count Utica together with Marcellus.
Sheng Wu,
Marcellus USGS estimate from 2019 is 306 TCF for TRR, 67% is 205 TCF, 50% of 205 is 103 TCF, cumulative Production to 2024 is 92 TCF, if output remains at about 9.5 TCF per year, we reach 50% of URR in 2026. I agree Utica is less far towards peak, USGS mean TRR is 186 TCF, 67% of that gives URR of 125 TCF, cumuluative production to 2024 is 22.4 TCF, recent output is 2.5 TCF per year, 50% of URR is 63 TCF.
From 2013 to 2019 Utica output increased at 0.5 TCF per year on average, if we assume that rate of increase occurs from 2025 to 2033, then cumulative production reaches 63 TCF in 2033 which could be the peak for this scenario. If Utica output remained on plateau at 2.6 TCF per year from 2025 to 2040, 50% of URR would be reached in 2040.
Note that USGS Marcellus estimate uses a very small average acre per well number of about 150 acres per well. If we assume a 15000 foot lateral and 1000 foot spacing, that would be 340 acres per well, so the 3 BCF per well from the USGS becomes about a 7 BCF EUR well, they were using wells from 2017 for their analysis, by 2020 I have the average Marcellus well at about 15 BCF EUR based on Novilabs data. This higher EUR number in 2020 may be due to more fracs per foot of lateral, higher proppant loading, and perhaps longer average lateral length. The USGS has done a pretty good job with tight oil estimates since 2013, especially if we discount the mean TRR by 67%, my guess is this same discount will work for shale gas as well.
Below is data for Marcellus and Utica shale gas in BCF/d through 2024 from EIA.
FYI
https://financialpost.com/pmn/business-pmn/trump-vows-completion-of-constitution-pipeline-for-new-yorkers#:~:text=Williams%20Cos.%20in%202020%20scrapped,the%20state's%20water%2Dquality%20concerns.
Dennis, as oil and coal reach their peaks, natural gas peak for the world (2040 peak) is brought forward as countries rush to switch. My guess is 2032.
US December Oil Production at All Time High
Production up by 95 kb/d. GOM 203 kb/d. Texas -78 kb/d. NM 24 kb/d. More on March 4 or 5.
a note about Argentina Vaca Muerta shale production,
the past year demonstrate 2 unique features,
1. the condensate-wet gas wells turns out to be the most prolific shale gas producers, the La Calera block and Bandurria Sur, Fortin de Piedra have wells with GOR around 6~80MCF/bbl, and the EUR gas could be 15~20BCF, same as dry gas in Marcellus, while the LaCalera could produce another 500 KBO on top of over 10BCF of gas, similar to the Permian oil core.
In the US, most wells with IP GOR at over 5MCF/bbl have quite poor production, even they are next to the core of lower GOR blocks and have high over pressure.
2. the low-GOR black shale oil wells continue to prove they could be producing as much lower decline rate while improving higher IP,
one in the very low GOR location, BPE2301 with GOR only ~60scf/bbl, produced over 500K BO in less than 2 years with a decline of only ~35% in the 2nd year. In BPE, the well BPE2202 with just over 200scf/bbl GOR become the Champion well of VM producing over 1Million BO in 18 months. Then just next to BPE, another low GOR 370scf/bbl, well BPO2801 reaching 1million BO in 11 months, with peak at the 11th month (last month) at 5,396 bblPD, making it the fast productive well in the whole Argentina history.
The unique features of VM to US marine:
1. slower speed reaching peak after IP, i.e. 3~7 months after IP for VM versus US marine shale oil 1~3months after IP.
2. decline is slower, 2nd year shows 35% for BPE versus 40% for VM rest average, and overall all slower decline after 2nd year than US marine.
Also, the block Confluentia Norte previously thought to be too immature to produce and even outside VM shale oil map, suddenly had 3 high IP wells (still peaking up) making to the best 20 oil wells, one as No3 after the 2 BPE/BPO wells, followed by the condensate wells of La Calera.
the data is free access,
https://app.powerbi.com/view?r=eyJrIjoiNDQ1OGQ4MGMtYmQyYi00NzYxLWFlNTMtOGI0ZjRhZGE4NTBkIiwidCI6IjVmMThiN2ZhLTdmMmQtNDQ5ZC1hZjhkLTliZTNiM2ViZmFhYSJ9
EIA 914 is out:
https://www.eia.gov/petroleum/production/
Overall US set a new record at 13.491 MM bopd. Fair to say it is still on the bumpy plateau, but no signs of dropping yet. More like a slight increase, over last year.
(I do expect a drop for JAN though. Weather in ND and actually a pretty deep freeze in the rest of CONUS.)
In terms of bigger states/regions:
*FGOM rebounded more than 200,000 bopd (presumably there was a hurricane in NOV.)
*Texas was down about 75,000.
*NM was up about 25,000 and (I think) just barely hit a new record.
(Not sure why TX went opposite direction of BOTH NM and FGOM. Maybe just one of those random vagaries.)
*ND was down over 30,000. Weather presumably. More to come next month…
In terms of the middleweights: CO and OK were down slightly. WY was up slightly.
In the little engine that could category:
*UT dropped again slightly.
*OH was up very slightly to 122 thousand bopd. A new record, I assume.
*MT dropped slightly. (Possibly weather driven, same region as ND.) But still kept a slight lead over…
*LA dropped very slightly. But enough to leave MT ahead of it.
*KS stayed the same. Those stripper wells are very low decline. Almost static.
US at about 13.2 Mb/d for 2024 average, my expectation is that output will increase to 13.7 Mb/d by 2026 (annual average) then start to decline, falling tight oil output may lead to relatively rapid decline after 2029.
On the natural gas side, US overall set a new record, barely, at 128.917 BCF/day. MoM the change was over 2BCF/day increase.
Note that AK is over 10 BCF of the US and sort of “doesn’t count”. 90% of it gets pumped right back into the ground. There is no connectivity to the rest of the continental gas pipeline system. And, the last (very small) LNG export facility closed years ago. That said, the change at AK was pretty small (up less than 0.15 BCF/day) last month, so I presume the “excluding AK” record was still accomplished. (Too lazy to check, though. But sometimes, you have to factor out AK to see what is really going on for a monthly change.)
PA was the big driver of the change, going up over a BCF/day. There is actually a fair amount of swing winter production. Because the anti fossil fuels crowds have blocked new export interstate pipelines, there is a fair amount of trapped gas in PA. You can’t produce gas and not send it anywhere…so the export pipelines get filled. And then local demand (which rises in winter) creates swing demand and higher production in winter.
OH and WV were relatively flat, but have less export issues (especially OH) since they are not as “trapped”, more connected to export or to Midwest or Southeast demand. I.e. they are more connected to Henry Hub. (Lower “diffs”.)
In terms of other large gas producing states, NM, TX, and FGOM were all up a small fraction of a BCF. However, LA, OK, CO, ND, and WY were all nearly flat.
Nony,
I look at marketed production or dry gas production rather than gross withdrawals. For Alaska marketed natural gas was about 1 BCF/d in Dec 2024 out of 116 BCF/d for US wet NG ( a new monthly record) and also a new annual record at 113.2 BCF/d for marketed NG.
Yeah, that is reasonable. I was just doing the quick and dirty. And I do know to look at AK (like if US goes up and AK is flat or visa versa).
One thing about just looking at dry gas is I don’t think you can see state to state differences. I think (donno, sometimes it is a maze to find the right page on EIA).
The other thing, of course, is then you have to look at NGLs as well.
Nony,
Yes the Dry Gas data is not great when looking for more granular state to state changes. The marketed (wet) gas data is pretty detailed (and goes back to 1900 for annual data), you don’t really have to look at NGLseparately, it is in the wet gas waiting to be separated at the NGL plant. The AK data is interesting, I had not realized how much was reinjected, though it makes perfect sense once pointed out.
Also note you have to look at NGL if considering Gross Gas as well (the difference between this and marketed gas is that flared, vented and reinjected gas is also included along with other gases that come up from the deep with the marketed gas.)
Nony,
The WV gas has been going slow but steady upward trend for the past 8 years, while OH gas has been steadily inching downward in the past 4 years.
if my guess is correct, the WV gas follows the SouthWest PA core, which both have been riding upward, and compared to NorthEast PA Marcellus dry gas core, where Marcellus in WV and SWPA are also enjoy the following factors,
1. The drilling and completion improvements impact on WV and SWPA are mostly positive, contributing both higher IP and slower decline. Boswell2021 and EQT are shocked by the productivity of the thin Marcellus in this 2 blocks, often recovery is close to 100% or higher! Lots of the acreage in WV used to be 2nd tier and now have EUR comparable to the core in SWPA. Some acreage in WV-OH-PA triangle have not only lots of gas but condensate/NGL EUR per lateral comparable to the Permian or EF non-core, yet the shallow depth let operators drill >3 mile long lateral and 100s of stages at lower cost.
2. The wet gas nature and added plants to process wet gases and petrochemicals, leading to derailment and better economics.
OH has been mostly drilling Utica shale with condensate and wet gas as the preferred target, and even a little Marcellus shale condensate located west of the Ohio river at just 5,000′ TVD depth, a couple of them could produce more condensate than the deeper Utica shale oil wells or even condensate wells in Eddy co NM at over 8~9,000′ TVD depth. The dry gas Utica part is not drilled as much because the cost is much higher, and wellhead dry gas price still too low. Even though OH, WV and SWPA all have the best most productive Utica formations, easily beating Haynesville in IP and decline and EUR.
Thank you Dennis for the great summary!
The OPEC refinery input data looks a bit suspect. For example, very divergent from EIA on USA. Looking at monthly data from EIA, I get 15,967 kbpd for 2023 and 16,223 for 2024…
Kdimitrov,
You’re welcome.
There may be other sources for this data, I agree on the EIA estimates for the US, they are different. This is the only source for this data except Energy Institute at the World level, that data may be better. Chart below uses Energy Institute data.
Rig Report for the Week Ending February 28
– US Hz oil rigs increased by 1 to 449. The count is also down 10 rigs from April 19, 2024 and is also up 22 relative to the recent lowest count of 427 on July 24th. The rig count has broken out of the very tight range between 427 and 442 since July and is on its way back heading for 450.
– The New Mexico Permian rigs were unchanged at 95 while the Texas Permian added 2 rigs to 195.
– In New Mexico, both Lea and Eddy were unchanged at 50 and 45 respectively.
– In Texas, both Midland and Martin were unchanged at 27.
– Eagle Ford was unchanged at 43
– NG Hz rigs were up by 2 to 82.
Frac Spreads Rebound for the Week Ending February 28
The frac spread count rose by 4 to 214. It is also down 58 from one year ago and down by 27 spreads since October 11.
Permian growth is over.
https://x.com/WhiteTundraSG/status/1895583501359202495?t=PbYStbOveES6usCUTXAA0w&s=19
Lightsout,
It is slowing, but not over. This is what EIA STEO forecasts through 2026. In 2026 6.85 Mb/d from 6.3 in 2024 for Permian region output. My forecast is lower with Permian output increasing by only 0.365 Mb/d from 2024 to 2026 rather than the 0.55 Mb/d increase predicted by the EIA in February.
Lightsout
There are signs that growth in the four main Permian counties, Eddy, Lea, Midland and Martin is slowing. Charts for these counties and a few others will be in the US update next week.
All these graphs and predictions of production peak are very informative. However they have become an end in themselves repeated over and over. Surely the point of all of this is to get an idea of what the world will look like when oil production starts falling by a million barrels per day or more each year?
Global GDP fell by $4 trillion in the Covid year of 2020 and global oil consumption fell by 4 to 5 million barrels per day.
We know over the last 20 years, that when GDP falls oil production falls, the link is still there despite the fact that global growth does not need as much oil to grow as it did in the past.
The Covid pandemic saw a major shift to home working for those who can, that is a one off adaptation which has been spent. Most people need to travel to work in factories, building sites, shops, restaurants, entertainment etc.
Currently most governments do not see an imminent peak in oil production. Electric cars are
Allowing oil to be used in the ever growing aviation industry and other sectors. Hence oil consumption is still growing and grew by over a million barrels per day last year.
The fact is global population is still growing by over 70 million and the increase is declining by only one or two million each year. So peak will not occur for at least 30 years unless there is some catastrophic reversal in birth rates.
By 2040 there will be another billion consumers requiring food to be grown and transported and all other items manufactured and shipped around the world. During this time oil production will fall by approximately 10 million barrels per day.
If global oil demand increased by 1.5 million barrels per day when electric vehicle sales hit over 20 million what would it take to bring demand to zero? Then what would it take to bring global oil consumption down to minus 1 million barrels per day each year going forward.
loads of oil,
Most of the consumption increase in “oil” was NGL, according to OPEC World refinery throughput has not returned to the 2018 peak, though it is close in the last 4 quarters (ending 2025Q1) and about 600 kb/d above the 2023 average level. Much of the demand for crude is for land transport, this can be replaced with electricity and natural gas.
Dennis
What is ready needed on here is an expert in the field who can give more than a simple and trite paragraph about one of the great challenges that faces humankind.
At the moment there are no electric HGVs that can carry the same amount of cargo for more than a fraction of what a diesel truck can. An expert would be able to fully explain issues such as this.
An expert would also cover in exact detail which sectors use exactly how much oil and the problems they will each face.
https://www.iea.org/data-and-statistics/charts/oil-demand-by-sector-and-scenario-to-2030
A very simple statistic. There are around 1.2 billion cars in the world and they use 25 million barrels per day. When global production reaches a plateau the only way aviation, marine and other industries will have enough to grow as before is to sell enough electric cars. Approximately the world would have to sell 45 million cars in order to for these other needs to be catered for.
If oil production starts falling by a million barrels per day, then 90 million would have to be sold, more than the current total. I have allowed for new cars using more than older vehicles.
An expert would be able to describe in detail the vast resources required to build a hydrogen infrastructure to power the 350 million trucks world wide.
Loads of oil,
There are lots of experts at the IEA, EIA, OPEC, Energy Institute, and at countless Universities that consider these problems. I am not an expert, nor have I claimed to be.
All trains have electric motors as their final drive.
Paul
I didn’t know that, perhaps they can be converted to electric power, but the task of installing electric overhead cables over hundreds of thousands of miles will take a long time and lots of money
Two points — Noting the efficiency of electric motors. Trains can still consume FF as they are 3 to 4 times more efficient than freight trucks.
Loadsofoil
It is not clear that global population will continue to grow for 30 years or more. For example, consider the series of posts by Tom Murphy (Do the Math blog) in June of last year. Tom makes a very reasonable case for a peak by 2040 between 8-9 billion and a drop to less than 5 billion by 2100. He also makes some even more compelling points about the lack of reliability in the UN models that are most commonly referred to in the press.
If I recall correctly, Dennis has previously posted some very nice analysis linking a more realistic (than UN) population projection with his oil production/demand forecasts to show little to no decline in available per capita oil through 2100. Dennis, do I have that right?
I suppose you are generally correct in suggesting that “the point of all of this is to get an idea of what the world will look like when oil production starts falling…”, but have a sense that there are some quite different underlying purposes, such as
Technical analysis of an interesting problem
Financial gain in short term and long term
Understanding how much of a carbon pulse is left to drive climate change
Understanding timing for energy transition needs and viable technical alternatives
Understanding personal and societal changes that are possible or warranted
Awareness of and prep for likely geopolitical and kinetic conflict consequences
Understanding impacts on various businesses such as shipping, manufacturing, infrastructure, etc
Hope, fear or other concern for our children
and more than a few others
T Hill,
I don’t remember doing that, I use the population projections from Wittgenstein Center in Austria from Wolfgang Lutz and collegues.
https://www.wittgensteincentre.org/en/staff/member/lutz.htm
data at
https://dataexplorer.wittgensteincentre.org/wcde-v2/
Found some analyses, not quite what you claimed, but after 2038 we might be ok, 2029 to 2038 may be a challenge. See comments below.
T Hill,
Here is a scenario I did in April 2024 using Wittgenstein Center SSP1 scenario for population and my oil shock model. After 2030 the World will need to use less oil per capita. Heavy Duty vehicles on land plus passenger vehicles use about 55 Mb/d of C plus C (in 2019), this is one area where oil use can be reduced from transition to battery powered vehicles, rail powered with electricity and perhaps natural gas (though this is also likely to peak and decline, so not a great solution).
If there is a shortage of oil it will lead to higher oil prices and increase the speed of the transition to electric land transport.
For this scenario from 2035 to 2075 the exponential trend for World per capita oil consumption is -2.27% per year. This scenario assumes a very slow transition to electric transport.
T Hill,
Scenario below assumes sales of plugin vehicles grows at 15% per year from 2026 to 2036 (recent rate has been about 25% per year in 2024), plugin vehicle annual sales growth in 2025 is assumed to be 20%. Heavy duty vehicle rates are assumed to follow the passenger vehicle rates of growth delayed by 10 years (2014 rate of sales growth for passenger vehicles occurs in 2024 for heavy duty vehicles). No change in air or water transport demand for oil is assumed (growth is offset by efficiency improvements/substitution).
The two analyses taken together suggest oil supply might be tight from 2028 to 2038 from 2039 to 2076 there may be plenty of C plus C for the assumptions I have made (no increase in demand from water or air transport.) After 2076 oil supply might become tight again, though this far in the future the scenario is likely very far from the mark as future technology advancements are impossible to predict.
T Hill,
This is my population projection based on the linear regression of the growth rate. If you are interested.
Iron Mike, your projection needs to updated with the current data.
It is 2025 and the population is at 8.2 B, rather than 8.7 that your chart shows.
My guess is a maxima just below 10 Billion at around 2060 +/- 10 years.
There has been pretty big downward shifts in the trend over the past 2 decades.
Hickory,
Yep i updated it. Here is what i got.
Linear regression of the growth rate.
I think we will peak much sooner. Something is bound to break.
Thanks Iron Mike,
My expectation is a peak around 2050 at about 8.7 billion. I expect there will be difficult times ahead, perhaps this will lead to changes in policy that improve things rather than making things worse. I would agree that currently positive changes do not seem likely.
“I think we will peak much sooner. Something is bound to break.”
Thats how it looks to me as well.
It’s not enough to have options to “transition” to. You have to be able to grow the options ie building endless amounts of machines that convert wind and solar into electricity and machines that use natural gas instead of diesel. And maintain these alternatives. All in a world of less oil supply.
Monetary system that allows all the supply chains to continue functioning breaks. You can’t payback debt plus interest in a world of contracting energy. Even if the energy contraction is just slight at first.
What it will look like is banks unwilling to lend into the economy. While at the same time every month as payments are made on existing debt. Which decreases the existing money supply. Economy gets eaten from both ends. Dollar shortage!
Which is exactly why government policy doesn’t matter. We are going into this contraction regardless of who is in office or what their policies are.
Pro climate, pro green tech or pro fossil fuels. None of it will change the outcome.
HHH,
In my opinion the “policy doesn’t matter” argument is bullshit.
Just read some economic history about the 1929 to 1933 period, bad policy makes the contraction much worse. The clowns that think policy doesn’t matter think 25% unemployment is the same as 10% unemployment, they are wrong.
It is correct that in both cases there is a contraction, but size matters.
Dennis,
I think what HHH is saying is in the specific scenario were surplus abundant energy is unavailable to service the global or domestic economy, government policy is futile.
Which i don’t personally believe we are currently in by the way (or possibly will be within my lifetime). But i think he thinks we are in a point in time were surplus energy is coming to an end.
Iron Mike,
I agree that a shortage of energy would make growth difficult, my main disagreement is the idea that policy doesn’t matter. I also tend to agree that monetary policy doesn’t help a lot during an economic contraction, kind of like pushing on a string. In those cases fiscal policy that is expansionary is the appropriate policy in my view.
The nonsense about balancing the budget (as touted by Elon Musk who knows little about economics) applies to households not to government, it is that type of thinking that leads to Depressions. During periods of low unemployment, balancing the government budget makes perfect sense by either cutting government spending or increasing taxation, or even collecting extra taxes to to reduce government debt so that deficits can occur during the inevitable future recession.
Dennis,
I agree and disagree with your views. While i agree depressions are detrimental and have a vast harmful effects on societies. So does growth, non-stop growth. It has deep detrimental effects on the climate and environment as well as societal impacts such as wall street becoming a casino knowing their gambles will be bailed out by tax-payers. It has also exasperating wealth inequality globally and wealth inequality intergenerationally. And now you are seeing the political side-effect of such an ideology being implemented.
At some point this economic growth like a cancer cell will end itself. I might not be alive to see it, but the consequences will be catastrophic.
Growth won’t continue after population starts to decline, I agree the growth does damage.
A low fertility scenario where the total fertility ratio falls to about 1.5 births per Woman on average leads to rapid population decline.
Wealth inequality has worsened with lack of progressive taxation and inheritance taxes which in the US became much worse after 1980.
Good policy can reverse wealth inequality.
Dennis,
If you go by the prediction of population peak, that is around 2050-2070ish. Possibly more than 25 years of growth. Do you not think how much more damage we will do ? I think you under estimate how destructive humans really are.
There will be no fixing of anything either. Wealth inequality, environment destruction, climate, the mentally ill society. i am much more pessimistic regarding the human psyche than you. We will continue down this path until something major breaks and the whole thing goes to shit. That is what i reckon, but what the hell do i know.
The net surplus hasn’t ended. But it’s in contraction. We can add more oil and make a new all time high in production. All while available energy to the economy shrinks.
Does it even matter if there is a new all time high in production if the net energy available to the economy has fallen a bit?
Iron Mike,
As I said, I agree growth causes damage, there are factors that counteract the damage, less burning of fossil fuels after 2030 or so is one factor, better design of products that can be repaired or are built to last so they do not need to be replaced or if they do need replacement can be recycled easily is another. Better tax policy such as existed in the US from 1936 to 1980 and led to less wealth inequality than previously.
Am I optimistic this will occur, no, but that does not mean we give up on what is good.
We do not live in a perfect world, one does not exist. All we have to decide is what to do with the time that is given us. (J.R.R. Tolkien)
HHH,
Net energy is notoriously difficult to measure. The World is using energy more efficiently as less fossil fuel is utilized, generally we only get about 35% of the primary energy converted to work, possibly less on average.
Dennis,
I agree net energy is hard to measure. But we don’t need a precise measurement to know that it is happening.
Even government fiscal spending is starting to fail globally.
Again it doesn’t matter what the policy is. We are not going to escape. It doesn’t matter what the tax policy is. Tax the wealthy at a 100% it doesn’t matter. It’s not going to change the outcome.
Dennis,
Here is how policy has impact but doesn’t change the ultimate outcome.
Tariffs. What do they mean for the global economy? Ultimately tariffs mean countries will be receiving fewer dollars. Which means fewer dollars to service the dollar denominated debt outside the US. Which is 4-5 times as large as the dollar debt inside the US. The rest of the world has way more dollar denominated debt than we do.
From a Eurodollar perspective if you’re a Eurodollar bank. You become risk adverse and pullback on making loans. Because you know there will be fewer dollars.
So global economy contracts as a result. This could be labeled good or bad depending on your point of view.
None of this has anything to do with the net energy available to the economy. None of this changes the net energy availability.
Ultimately the economy is going to contract to be inline with the energy availability. No amount of government fiscal or central bank monetary stimulus is going to change this.
No policy put forward will change net energy.
We are actually going to overshoot contraction to the downside. That way later on growth will return but it will return to a much, much, much smaller economy.
There will be a lot of money fleeing depreciating currencies outside the US. And where will that money end up? In US assets. T-bill will get bid through the roof. Meaning much lower interest rates.
HHH,
Net energy can change depending on the energy mix, the World economy continues to create more output per unit of energy consumed.
DC
The 1929-1933 crash is actually very similar to what is happening now. Coal production from coal based power peaked in 1927 and crashed the market. The switch to an oil based power led by the US bailed the global economy out and has allowed new peaks in everything. Policy can’t replace energy. Sorry
Loads of Oil
Good to hear you considering these important questions.
The setup for shortage of oil products in a world approaching 9 billion remains the upcoming scenario.
Who (which countries) among us is operating with this presumption in mind?, as opposed to most who behave as if the current supply situation will continue indefinitely?
Most people alive in the world will experience the effects of oil shortage if they live long enough.
In a country like the US we pretend that Permian is inexhaustible… extremely shortsighted.
Hickory
People keep underestimating the demands of a growing population and one which is getting richer. The billion poor people do not use much, but China has grown into a consuming monster, consuming more trees, fish, oil, coal.
The additional billion plus people between now and 2040 will want their share of everything we use.
India is the new China. India is building tens of thousands of miles of roads between ever expanding towns and cities. Airports are being built all over the vast country, anyone who thinks air fuel demand and maritime fuel demand will not increase should do a bit a research.
There simply will not be enough to go round. I see electricity prices continue to increase as demand increases and oil prices increases as production falls. Things will become very difficult for the poorer half of every country.
World Jet/kerosene fuel consumption
That is out of date.
Global consumption of aviation fuel in 2024 was above 2019.
And estimates say 2025 will be higher still
https://www.opisnet.com/blog/2025-likely-to-bring-lower-jet-fuel-prices-higher-demand/#:~:text=IATA%20also%20said%20that%20the,over%20the%20last%20several%20quarters.
Loadsofoil,
Where are you getting data for World jet fuel consumption in 2024? I only have data through 2023. There are forecasts for 2024, often these are incorrect.
Here is EIA data through 2023 (previous chart was from Energy Institute). Peak was 2019 at 7199 kb/d, in 2023 it was 6581 kb/d for jet fuel consumption at the World level.
IEA World Outlook Scenarios, Oil Consumption for Transport Use in EJ, this is all transport by land, air and water for all uses.
Link to World Outlook 2024 below
https://www.iea.org/data-and-statistics/data-product/world-energy-outlook-2024-free-dataset#data-files
Dennis
https://oilprice.com/Energy/Energy-General/Economic-Uncertainty-Dampens-Jet-Fuel-Demand-Outlook.html
According to Goldman
Loadsofoil,
Not clear that jet fuel consumption has exceeded the 2019 peak yet, I will wait for 2024 data from EI and EIA, should be out in late June from EI, not sure when EIA will publish 2024 consumption data.
Water transport demand from IEA World Outlook (all types of energy in EJ). My guess is the IEA has done some research on this.
IEA has air and water transport energy demand increasing, except in Net Zero scenario for World Outlook 2024, mostly due to increased air transport demand.
Some of future use is expected to be non fossil fuel by EIA, chart below looks at carbon emissions which reflects fossil fuel use for air and water transport.
I don’t think policies are going to bend the curve much on global combustion.
By and large, people will consume whatever they can afford to,
which is a reflection of supplies and overall prosperity level.
Hickory,
I disagree. Policy matters. Are you familiar with economic history? For example US from 1929 to 1937?
Yes, I mean, the only real truth is that we all come from s-x and we all die in the end.
Wonder if this comment will be allowed.
US refiners mull switch to alternative lighter crudes amid Trump tariff fears
6:01 PM ET, 02/20/2025 – Reuters
*
Marathon Petroleum, HF Sinclair, Delek say could pivot to alternative crudes
*
Tariffs on Canada, Mexico would boost feedstock cost, squeeze refiner margins further
*
Majority of US refinery capacity slated to run cheaper heavy Canadian, Mexican crude
*
Analysts see inland refiners sticking with current heavy crude diet
*
Switch to lighter crude raises challenge of converting refining units
*
Refinery output could drop due to cost or limited heavy crude supplies
By Nicole Jao
NEW YORK, Feb 20 (Reuters) – Top U.S. refiners are poised to seek alternative sources for heavy, sour crudes, including running more domestic grades, as they await clarity around U.S. President Donald Trump’s threatened tariffs on imports from the nation’s top crude suppliers Canada and Mexico, executives said.
Running more domestic crude, which is predominantly light, sweet shale oil, through U.S. refineries could be a win for Trump, who has vowed to boost the nation’s energy production and championed the fossil fuel industry.
The tariffs, however, have generated concern among refiners, who are already watching profits slide from record highs in 2022 on softer demand, as they would now take a hit from higher feedstock costs. More than 70% of U.S. processing capacity is configured to run heavier grades, which are cheaper to import from Canada and Mexico.
Trump, who took office on January 20, plans to charge a 25% tariff on Mexican crude and a 10% levy on Canadian crude beginning in March, a delay from his original plan. Canada, the biggest oil supplier to the U.S., exports some 4 million barrels per day (bpd) of crude into the U.S., 70% of which is processed by Mid-Continent refiners.
Marathon Petroleum, the top U.S. refiner by volume, said its refineries in the Mid-Continent region could switch from processing heavy sour crude to other grades.
“We could look to pivot to alternative crudes because of our logistics capabilities,” Rick Hessling, chief commercial officer at Marathon Petroleum, told investors during the company’s fourth-quarter earnings call this month.
Hessling added that domestic crude from the Bakken shale formation in North Dakota and the Rocky Mountains could be among their options.
Ohio-based Marathon operates 13 refineries in the U.S., six of which are located in the Midwest. Its 253,000-bpd refinery in Robinson, Illinois, processes large amounts of heavy crude from Canada.
The refiner warned that costs could rise if Trump’s tariff plans go through, but the burden would primarily be borne by Canadian oil producers and, to a lesser extent, U.S. consumers.
“We’re working with the administration and we’re working with agencies, as well as the trade associations, to be sure that the right people understand the implications of these decisions,” Marathon CEO Maryann Mannen said.
Texas-based HF Sinclair, which operates seven complex refineries, could process more light sweet crude.
“What we believe in our refineries is we have the ability to lighten up,” Steve Ledbetter, executive vice president of commercial at HF Sinclair, said during the company’s earnings call on Thursday. Its refining system is connected to the key crude oil delivery hub in Cushing, Oklahoma, Ledbetter added.
Its 94,000-bpd oil refinery located in Sinclair, Wyoming, and 135,000-bpd refinery in El Dorado, Kansas, need to run a certain amount of heavy crude, he said. “But we can minimize what that is and introduce a lighter slate.”
Independent refiner Delek, which operates four inland refineries, could run more light, sweet crude if it is economic to do so, its CEO Avigal Soreg said earlier this month.
“We have knobs to open,” he said, emphasizing that the company would do whatever was most economic.
However, converting units to process lighter crudes economically would require refiners to invest in new equipment. Lighter crude tends to produce higher volumes of petrochemical feedstock naphtha and less of the more profitable diesel and jet fuel, which could also force some operators to reduce the amount of crude they run overall.
“If you’re configured to run heavy sour crude in the Midwest, your other options, broadly, are not going to be as desirable, as economic,” said Jason Gabelman, analyst at TD Cowen.
TD analysts expect U.S. refiners that run Canadian crude on the margin to switch to light sweet crude, thereby increasing the prices of U.S. benchmark West Texas Intermediate crude futures (WTI) and global benchmark Brent crude. Both benchmarks are light sweet grades.
Inland refiners that run Canadian crude as a core part of their diet would likely stick with their current crude slate, the analysts said.
Phillips 66, HF Sinclair and Par Pacific Holdings have elevated exposure to Canadian crude, data from TD Cowen shows.
Besides the lower transportation costs due to proximity, the price of a barrel of Canadian oil is still far cheaper for Midwest refiners than a comparative local grade produced in the Gulf of Mexico.
A barrel of Western Canada Select (WCS) heavy crude in Hardisty, Alberta, was reported to trade last at about $13 under WTI, compared with Mars Sour , a U.S. medium sour crude produced along the U.S. Gulf of Mexico, at about a $2 premium to WTI.
BRACING FOR IMPACT
Ahead of the impending tariffs, U.S. imports of Canadian crude
hit record highs
in January.
Valero Energy, the second largest U.S. refiner, anticipates a reduction in refining throughput if heavy crude feedstocks become limited, executives said during the company’s earnings call last month.
“A lot depends on how far it goes and how deep you have to back off on some of those heavy barrels,” said Greg Bram, vice president of refining services.
The San Antonio-based refiner’s 360,000-bpd Port Arthur refinery in Texas processes Mexican heavy sour crude oil into gasoline, diesel and jet fuel.
“The Mid-Con needs Canadian oil to maintain throughput,” said PBF Energy CEO Matthew Lucey. “Anytime that there’s going to be disruption of that size, if it happens, it will have some impact on throughput.”
Houston-based Phillips 66 said the tariffs may divert Canadian oil away from the U.S. at first, while the 457,000 bpd of Mexican crude that comes into the U.S. could move to Europe or Asia instead.
“Without having really any clarity on what’s going to happen, there is no way we can really speculate on how we deal with it. We’re just going to have to deal with it when it comes up,” said Valero’s Chief Operating Officer Gary Simmons.
(Reporting by Nicole Jao in New York; Editing by Liz Hampton and Marguerita Choy)
HB
This appears to be a lengthy collections of statements from a variety of sources, so of which contradict one another.
Few people actually have an in depth knowledge of refining and that usually includes the management at the top, who defer to those below to brief them. Many of those briefing do not tell it how it really is.
I know form old. After 46 years in oil, gas and petchems I was amazed how information for the top management had to be sterilized to avoid bad news. Bad news affects share prices, and executive bonuses.
There is plenty of bad news to come, but most CEO’s will be hoping to have moved on by the time the truth comes out and the blame game starts.
I digress. AS Trump morphs into Putin II and imposes tariffs on imports he is about to get a tough lesson on refining.
Try as they might the US refining configurations do not lend themselves to the ramping up of light crude in the feedslate.
The bulk of US refining capacity is in the South, geared up to process heavier sour crude in high conversion refineries that are optimized to produce roughly 45% gasoline from each barrel, which is considerably higher than in most other regions, where 20-25 % is the norm.
The old days of formulating gasoline with 35-200 degree Celsius boiling fractions and a good dollop of lead alkyls are long gone. Now we have reformulated gasolines that are increasingly more molecule specific and more challenging to produce.
Limits have been introduced on aromatics, olefines and sulphur and high octane alkylates and ethanol are in vogue.
Making these reformulated gasolines is much more energy intensive and requires careful blending
The main components in US gasoline are:
FCC gasoline – produced on a Fluid Catalytic Cracker form vacuum gas oil
Reformate – produced from heavy naphtha in a catalytic reformer
Alkylate – produced from the C3-C4 stream from the FCC
The crude distillation unit primarily splits the crude stream into 4 products
1. LPG and full range naphtha 0-180 deg C
2. Jet – Kerosine 180 – 230 deg C
3. Diesel 230-365 deg C
4. Atmospheric Residue 365+ deg C
The atmospheric residue is processed in a Vacuum Distillation unit to produce:
1. Light Vacuum Gas Oil 365-400 deg C
2. Vacuum Gas Oil 400-550 deg C
3. Vacuum Residue 550+ deg c
Each draw off on the CDU and VDU will have a hydraulic limit. When that hydraulic limit is achieved on any of the draw offs then the unit is maxed out, and separation is compromised .
Thus, crude unit designed to run 31 API crude oil will have physical limits on all of the draw offs. Here is a good example of the problem:
Crude Bakken Arab Heavy
API 43 29
Naphtha 43 19
Jet 11 7
Diesel 17 17
VGO 17 31
VR 6 23
Yields in vol%
It is now easy to see the challenge. Bakken has over double the yield of Arab Heavy for naphtha.
Arab Heavy has more than double the yield of Atmospheric Residue of Bakken (VGO+VR)
Only the diesel yield is about the same.
Adding Bakken to the crude slate will progressively lighten the crude and flood the top pf the crude unit- REDUCING crude throughput and increasing costs. Gasoline production will GO DOWN along with all other products. Net Effect- gasoline pricing will increase and imports of gasoline from outside the US will increase. Voters will be hacked off.
However in terms of the impact it gets worse. The Bakken light naphtha is rich in paraffins and not really suitable for gasoline.The medium and heavy naphtha is naphtha suitable for reforming but there are limits on the volumes of reformate that can be blended. The Bakken VGO yield wis about 60% of the Arab Heavy and would limit the output of the FCC and the FCC gasoline and Alkylation unit output.
This is a very simplified overview but it shows the idiocy of the Trump regime in believing that they can run on domestic crude. Technically it would be possible but only with massive reconfiguration of the refineries at a cost of $ billions with no guarantee of a payout. Few people can understand refining and the constraints on the product yields. The ability to increase or decrease a particular product is limited. In the EU diesel demand exceeds the supply and no amount of refinery optimisation is going to yield significantly more diesel.
Over the past 70 year the emphasis has been on breaking larger molecules into smaller gasoline type products, using cracking technology. Although technologies to produce diesel from VGO (hydrocracking), there is no simple reliable and affordable technology to turn naphtha into diesel. Those technologies require the production of olefines (ethylene, propylene, butenes) and the oligomerisation of these molecules into carbon chains of C14-C20.
The alternative is Fischer Tropsch chemistry which works but is extremely expensive and energy intensive.
I think that is enough for today on LTO.
My other interest which rarely gets aired is the subject of reservoir fluid dynamics and the impact on ultimate recovery. All the models on the TRR are fine but really matters is the how the resource is produced, the geo-physics and the control of the reservoir pressure(if any). Most LTO is akin to volatile oil rather than black oil and the gassing of the the NGL’s in the reservoir is a major issue. Geologists tend not to be very good at fluid dynamics.
Carnot,
Is your expectation that the TRR estimates by the USGS are far too high? I use about 67% of mean TRR estimate for URR for tight oil, does this seem too optimistic? I would think geophysicists might have a handle on fluid dynamics.
Dennis do you have an opinion about the model produced by Goehring and Rozencwajg? Am a little skeptical of any model where I can’t see the math or the source code myself.
Jacob,
I think their model is a bit pessimistic, but like you do not have access to the underlying model. They likely have access to data that I do not so potentially they are correct and my scenarios are too optimistic.
I guess the short answer is that I do not know,
Apparently the use a logarithmic hubbert curve instead of lineariztion. I don’t know if that would avoid the same pitfalls Robert Rapier noted.
Jacob,
I forgot about the logarithmic Hubbert Curve claim, I don’t buy that one.
Am personally skeptical of hubbert based models when you peel the hype way am not impressed by the predictive power.
Jacob,
I agree.
An update regarding U.S. December oil Production has been posted.
https://peakoilbarrel.com/u-s-december-oil-production-at-all-time-high/
A new open thread Non-Petroleum has been posted.
https://peakoilbarrel.com/open-thread-non-petroleum-march-5-2025/