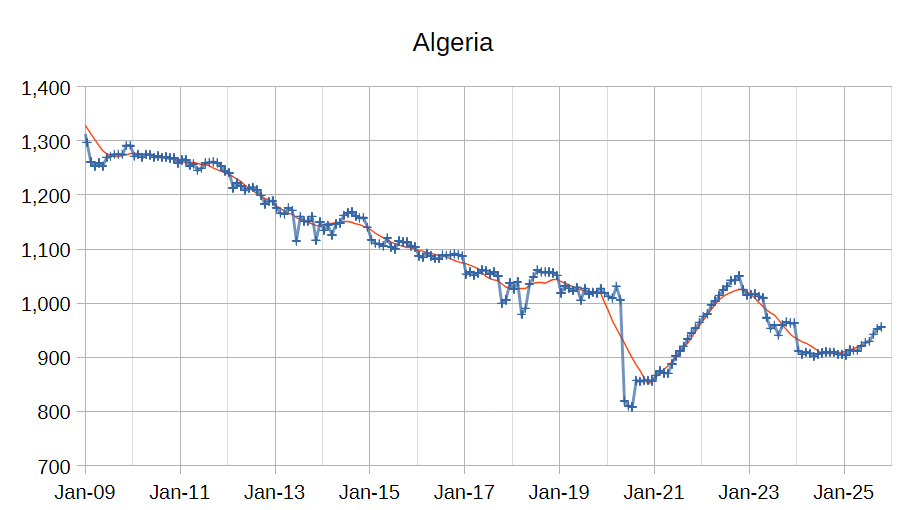
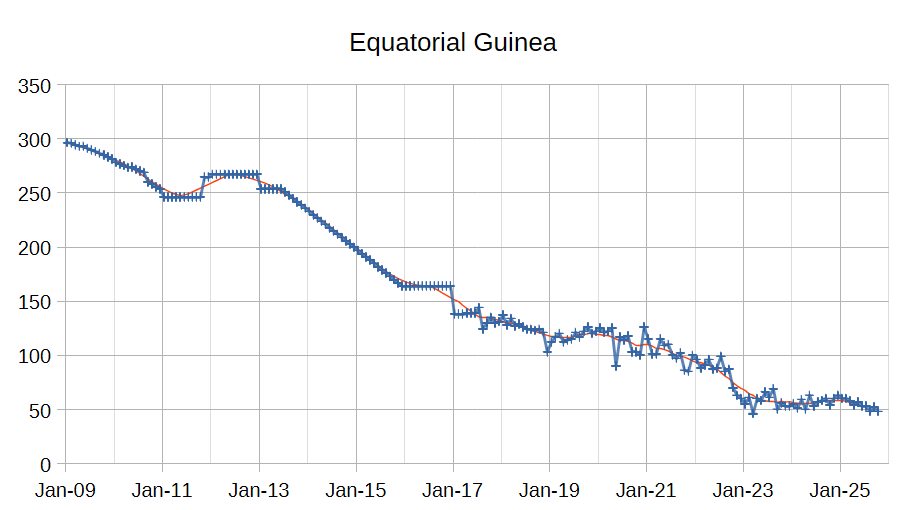
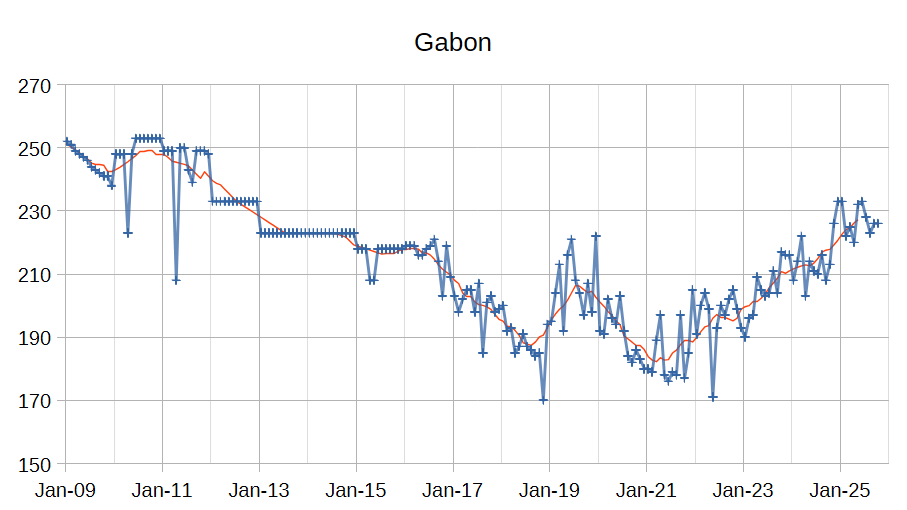
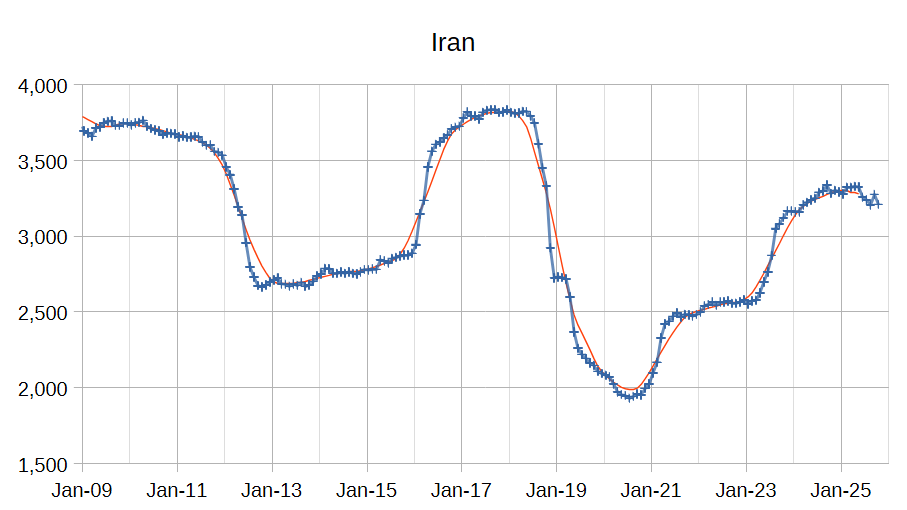
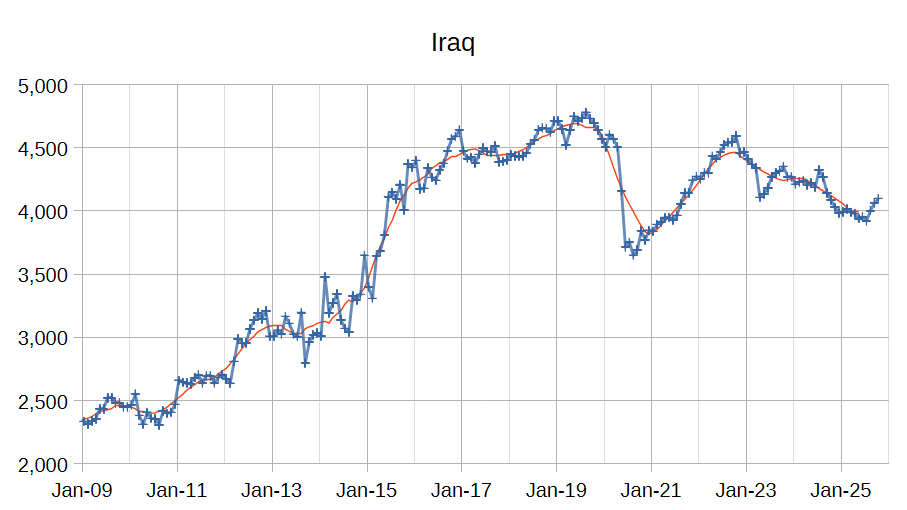
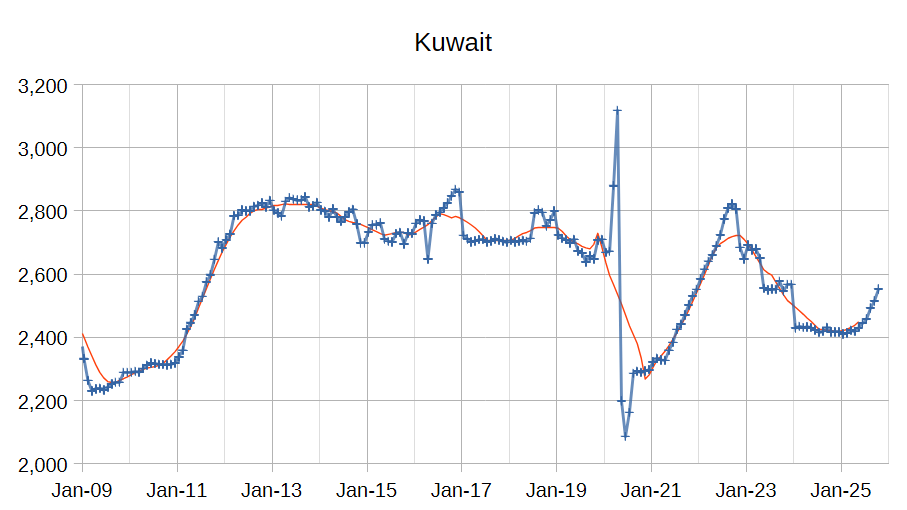
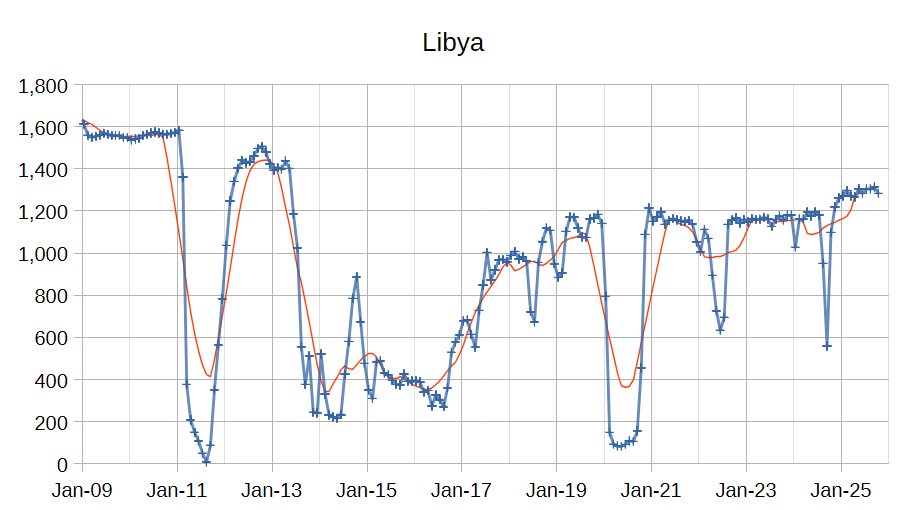
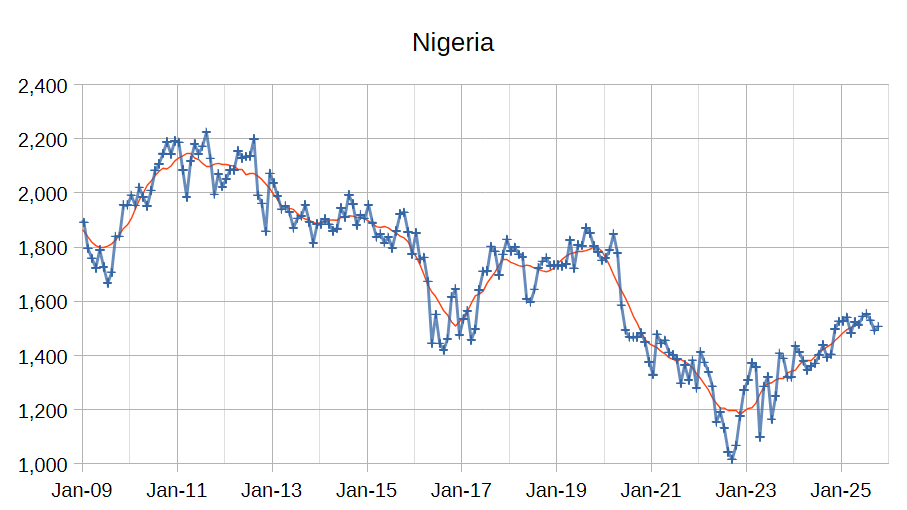
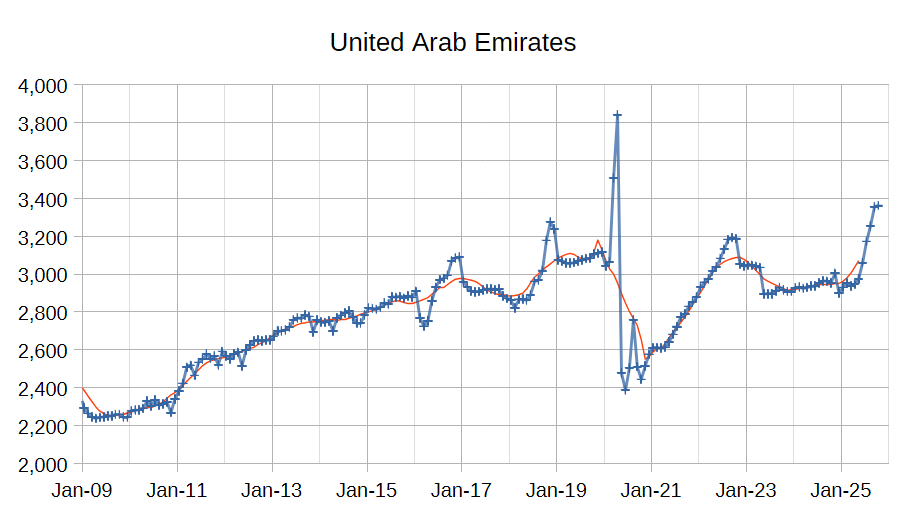
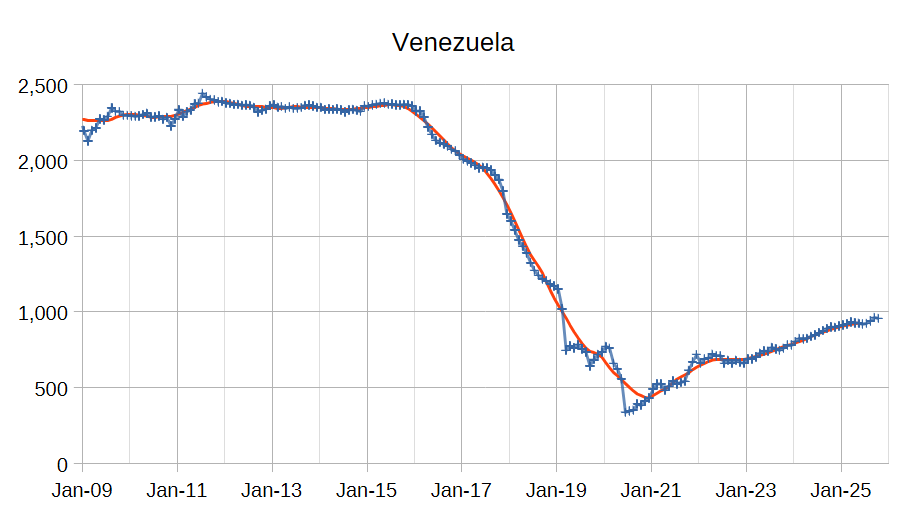
The OPEC Monthly Oil Market Report (MOMR) for November 2025 was published recently. The last month reported in most of the OPEC charts that follow is October 2025 and output reported for OPEC nations is crude oil output in thousands of barrels per day (kb/d). In the OPEC charts below the blue line with markers is monthly output and the thin red line is the centered twelve month average (CTMA) output.
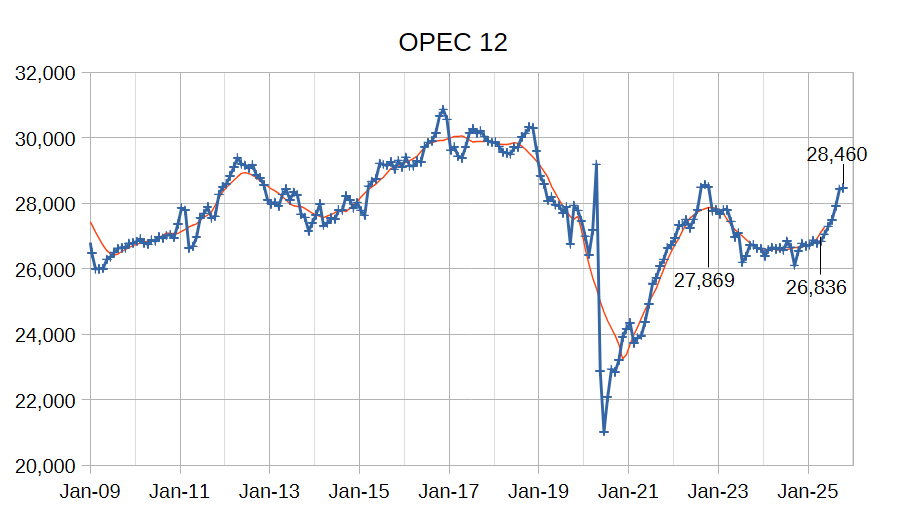
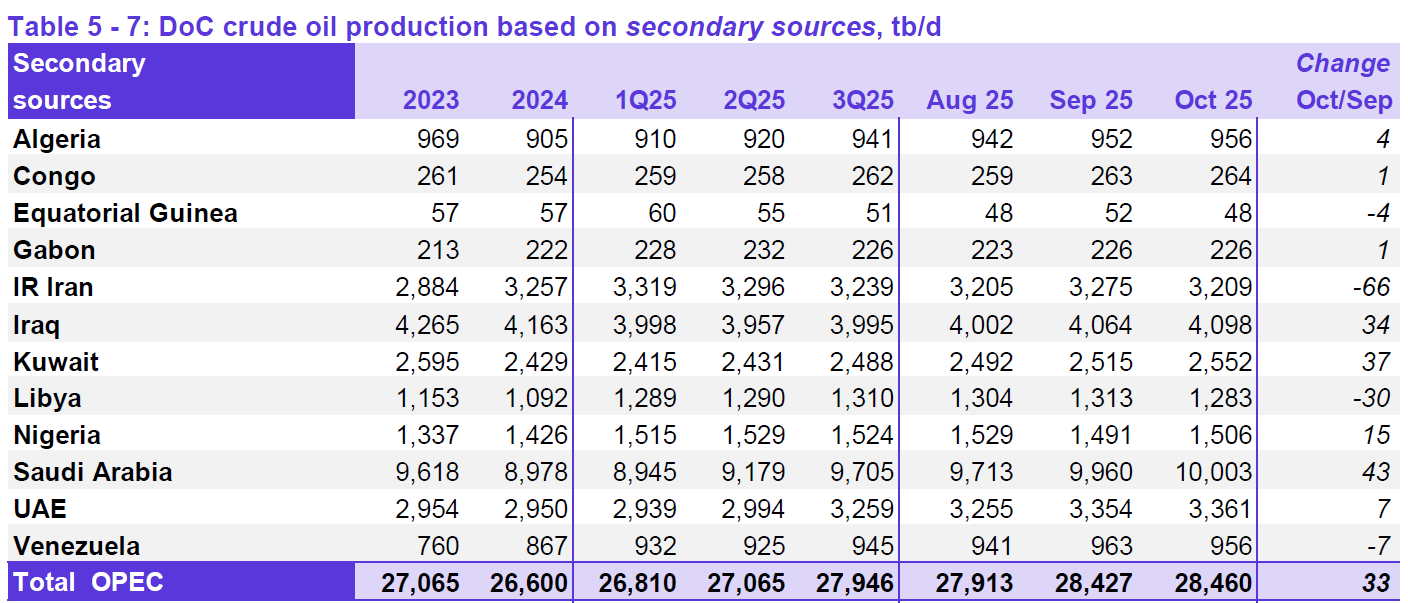
OPEC 12 output for September 2025 was revised lower by 13 kb/d and August 2025 output was revised lower by 3 kb/d compared to last month’s report. OPEC 12 output increased by 33 kb/d with the largest increases from Saudi Arabia (43 kb/d), Kuwait (37 kb/d), Iraq (34 kb/d) and Nigeria (15 kb/d). Iran (-66 kb/d) and Libya (-30 kb/d) saw decreased crude output. All other OPEC members had small increases or decreases of 7 kb/d or less. Combined output from the other 6 members increased by 2 kb/d in October from the September level.


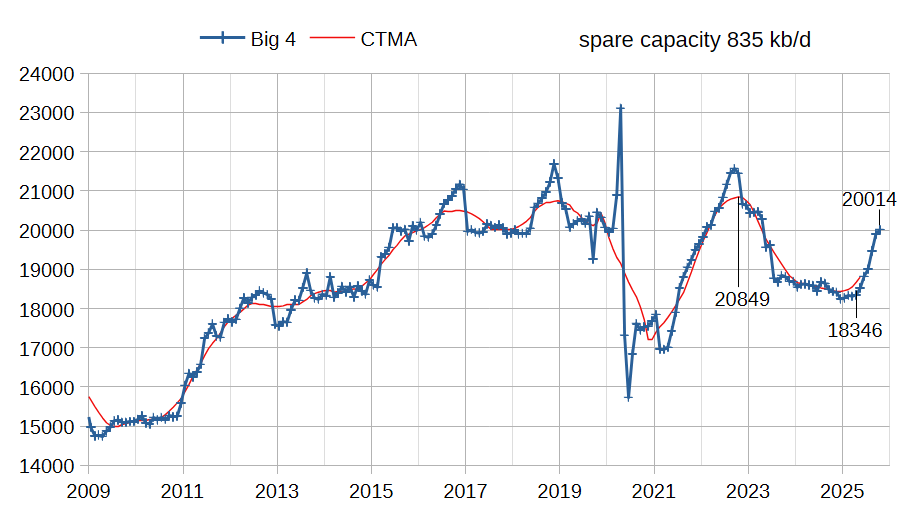
The chart above shows output from the Big 4 OPEC producers that are subject to output quotas and where most of OPEC spare capacity currently exists (Saudi Arabia, UAE, Iraq, and Kuwait.) After the pandemic, Big 4 average output peaked in 2022 at a centered 12 month average (CTMA) of 20849 kb/d, crude output has been cut by 835 kb/d relative to the 2022 CTMA peak to 20014 kb/d in October 2025. The Big 4 may have about 835 kb/d of spare capacity when World demand calls for an increase in output. Since April 2025 the OPEC Big 4 have increased output from 18346 kb/d to 20014 kb/d, an increase of 1668 kb/d in just 6 months (an average monthly increase of 278 kb/d.) If the rate of increase of last month for the Big 4 (121 kb/d) continues in the future, OPEC spare capacity would run out in about 7 months. Perhaps this is part of the reason that future increases after December 2025 have been put on hold as spare capacity will be down to about 595 kb/d by the end of 2025 (assuming a 240 kb/d increase in output by the Big 4 over the next 2 months.)
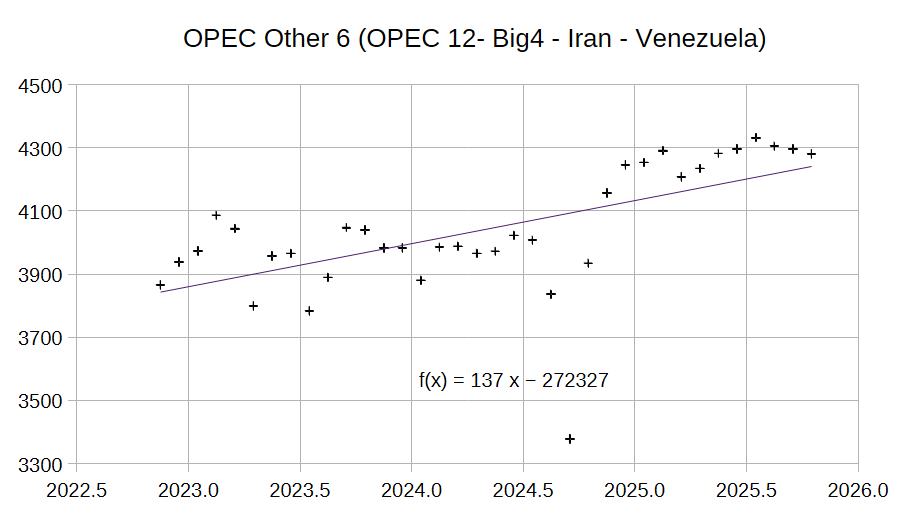
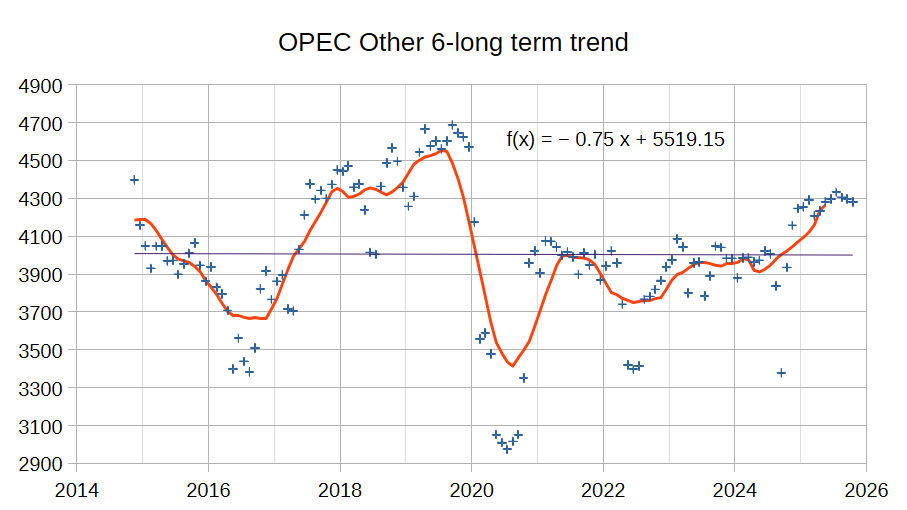
The chart above shows the most recent 36 month average annual increase of 137 kb/d for the Other 6 OPEC group which excludes the Big 4 and Iran and Venezuela. Iran and Venezuela have seen their output rise over the past 3 years at an annual rate of 364 kb/d which I believe will fall to zero in the near future. The chart below shows the long term trend for the OPEC Other 6 which is roughly flat (a small average annual rate of decrease of 0.75 kb/d) over the past 11 years. I expect the Other 6 will see their output return to this flat trend in the next few years.
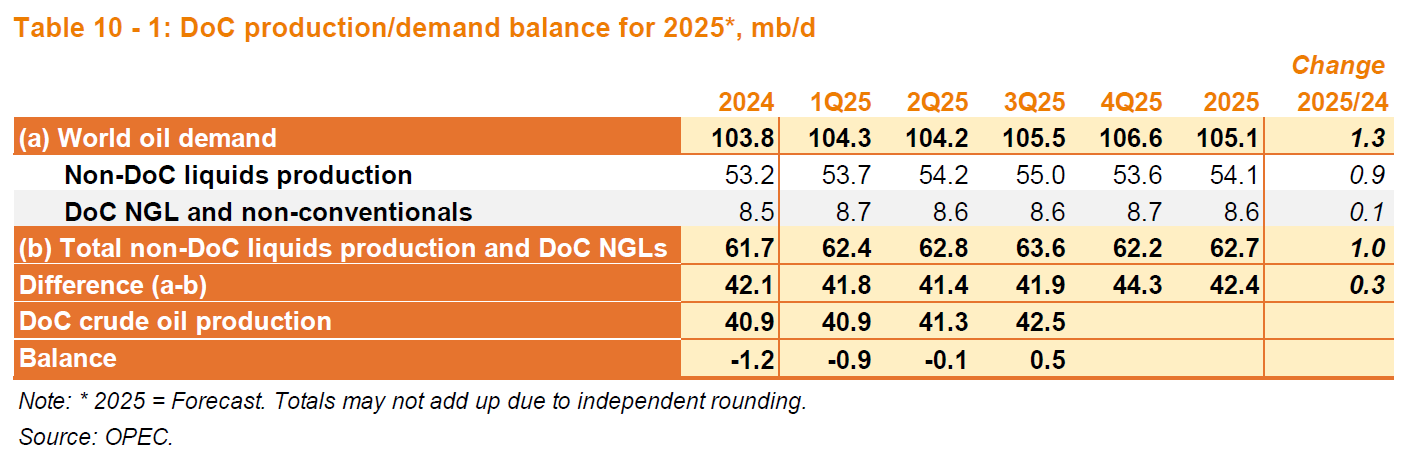
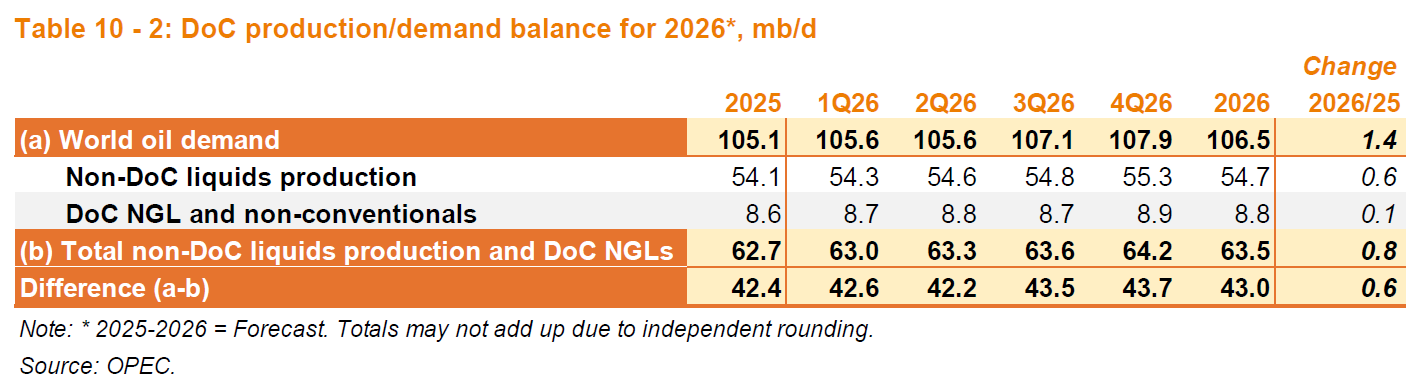
The only change in the production/demand balance from last month’s MOMR is a 100 kb/d increase in the forecast for Non-DOC liquids production in 2025, this reduces the increase in the call on OPEC by the same amount because the demand forecast is unchanged from last month’s report.
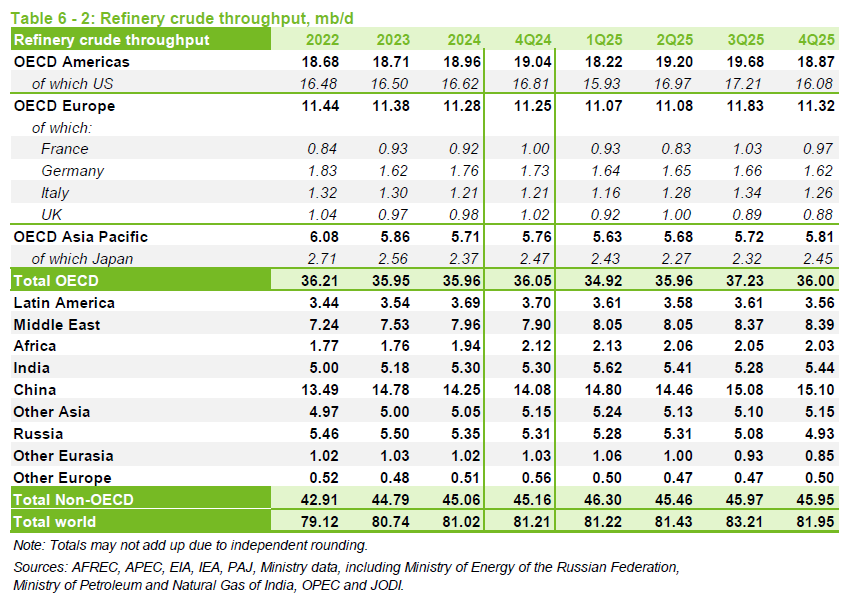
Refinery crude throughput is a measure of World demand for C+C (though imperfect because some crude is burned directly in power plants in the Middle East.) OPEC data shows the previous peak was 81.68 Mb/d in 2018. For the most recent 4 quarters (ending 2025Q3) the average World refinery throughput was 81.77 Mb/d, a new annual average peak and a significant revision from last month’s report at 81.34 Mb/d for the same 4 quarters.

From the November MOMR:
Preliminary September 2025 data show that OECD commercial inventories rose by 6.0 Mb, m-o-m, to stand at 2,845 Mb. At this level, OECD commercial stocks were 37.7 Mb higher than at the same time last year, but 22.4 Mb lower than the latest five-year average, and 122.3 Mb below the 2015–2019 average.
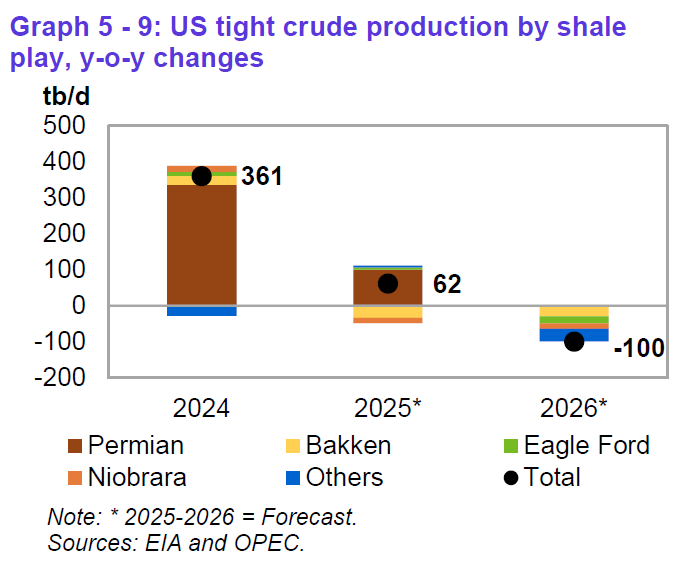
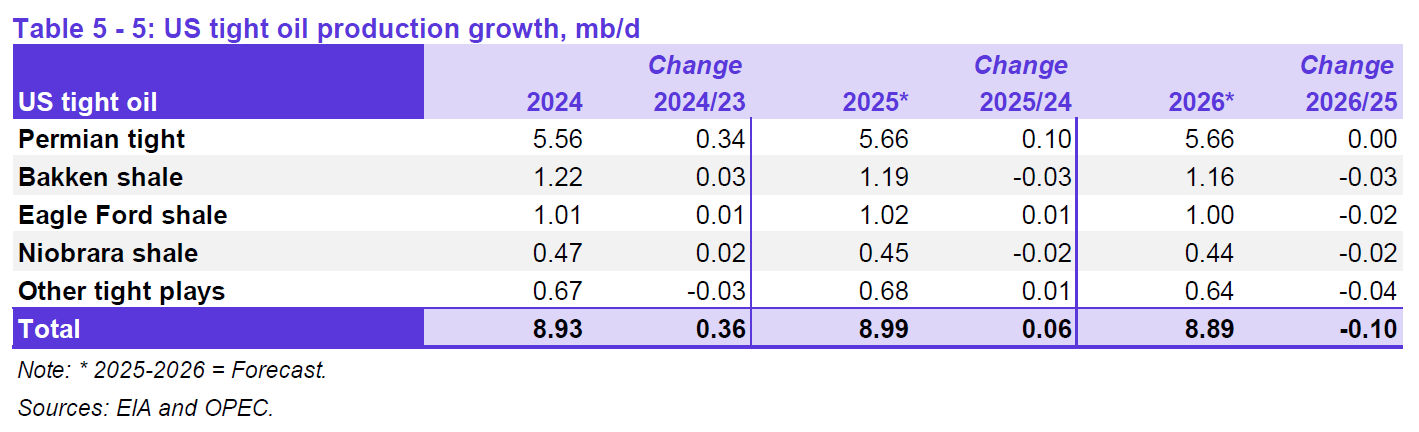
OPEC has reduced its estimate of US tight oil output in 2025 and 2026 compared to last month’s report by 10 kb/d for both years. Also the estimate for 2024 increased by 10 kb/d compared to last month’s report (in line with data from the EIA), so the increase in tight oil output from 2024 to 2025 is 20 kb/d lower than last month’s report while the decrease in tight oil forecast from 2025 to 2026 is unchanged from last month’s report.
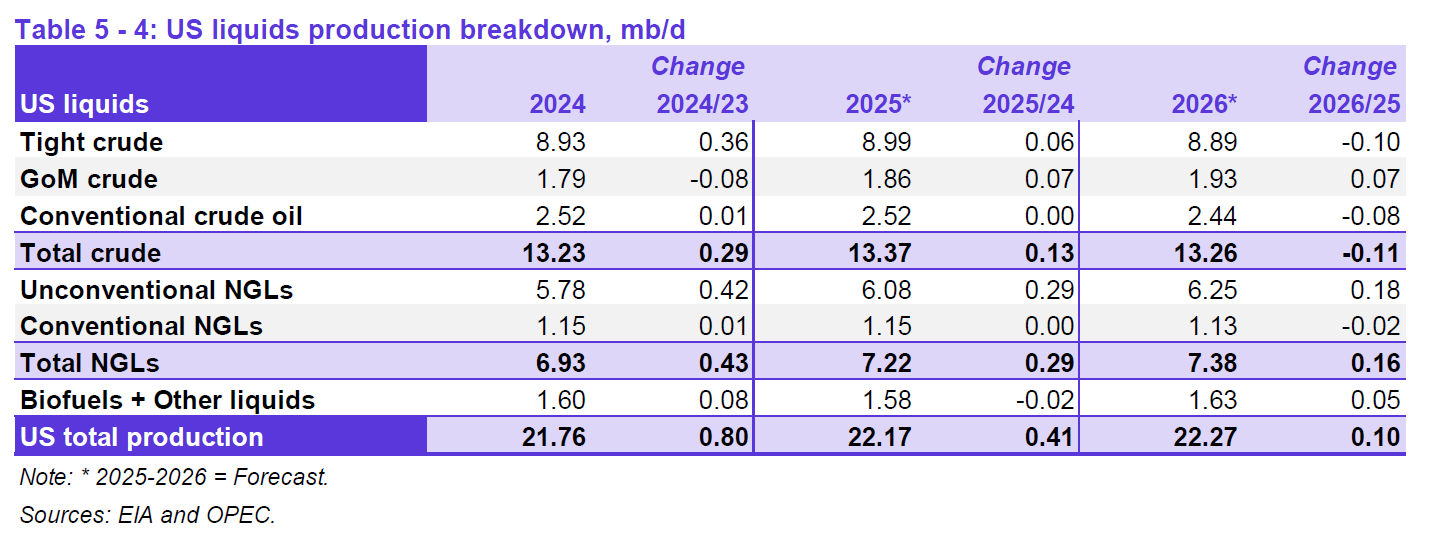
OPEC forecasts US C+C output to increase by 130 kb/d to 13.37 Mb/d and to decrease by 110 kb/d in 2026 to 13.26 Mb/d. The latest STEO from the EIA forecasts 13.59 Mb/d in 2025, 220 kb/d higher than the OPEC forecast, in 2026 the EIA expects US C+C to fall by only 10 kb/d compared to the 2025 annual average. For 2026 the difference between the two forecasts is 320 kb/d. If we assume these two forecasts are equally likely, the average of the two is 13.48 Mb/d in 2025 and 13.42 Mb/d in 2026. My guess is the OPEC forecast will be closer to correct.
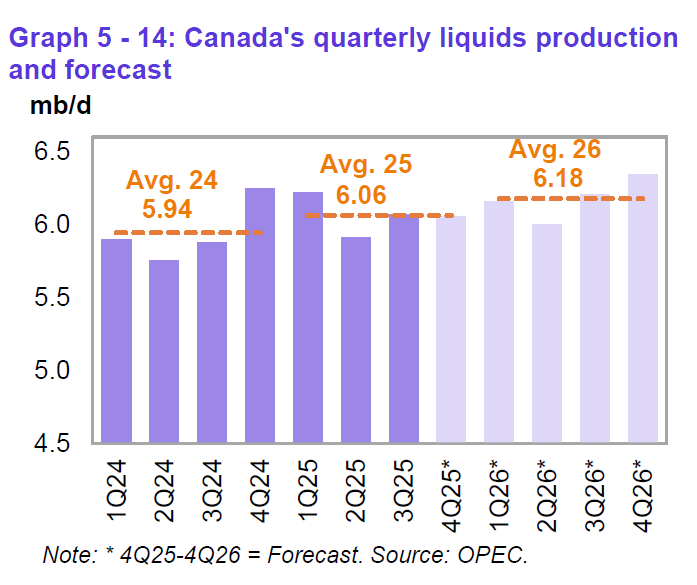
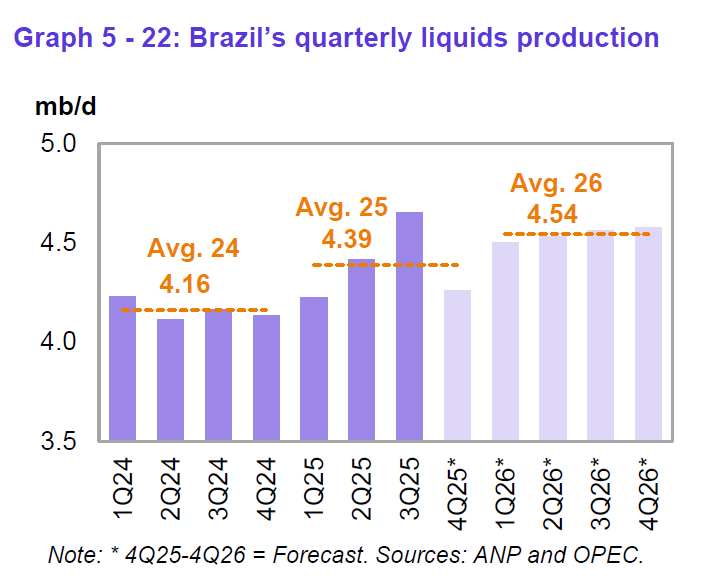
Above are two forecasts for output from non-OPEC+ nations from the November MOMR. OPEC forecasts Latin America non-OPEC output to increase by 300 kb/d in 2025 and by 500 kb/d in 2026. By deducting Brazil’s output and assuming the rest of the increase comes from Argentina and Guyana we get an increase of 70 kb/d in 2025 and 350 kb/d in 2026 for combined Argentina and Guyana output of liquids.
74 responses to “OPEC Monthly Oil Market Report, November 2025”
How can I keep up with you on social media? X or Instagram ideally
Thanks
I do not use either of those, sorry. Not really into the social media thing.
Interesting perspective on energy as the basis of wealth. and electricity as the emerging most critical element of energy wealth.
‘Electricity is about to become the new base currency and China figured it out’
https://electrek.co/2025/11/21/electricity-is-about-to-become-the-new-base-currency-and-china-figured-it-out/
Hickory,
The problem is that too much political and economic power is in the hands of the State which can make bad decisions. The west would be wise not to rely too heavily on Chinese imports and perhaps to counter Chinese economic power with better public private partnerships and better government regulatory policies and planning (especially true in the US, I am less familiar with policies elsewhere).
Hickory
Sure,
More energy is better than less, if we exclude externalities. I am not sold on the renewables is obsolete argument in the slightest. I would argue that a high price for the short term would stress the market for electricty and not be detrimental for the long term. Rather very beneficial.
It is a lot of up front costs, and I am not sure if the wind parks in the North Sea did reach the goal to facilitate low costs short term (as Iver in prior threads stated as the goal). Maybe the US or Austrialia can be smarter in how to build out the necessary infrastructure more cost efficient. When combining wind and solar, together with more traditional electricity sources AI is needed badly to optimise the grid (because it is a very complexed scenario).
But to claim that more than 30% wind/solar in the electricity grid creates big problems is not true. It could be the case, but in some places you have hydro power and other sources as back up and the right grid connection to supply 70%+ of the grid. If you only talk about industry; cheap energy coal/gas at the source creating products transported directly to the market would always be benefical. We are still in this growing sentiment. Europe is a dwarf globally compared to the total pie – if not the Russia invasion would have been much more detrimental.
DC,
I don’t see the point of the article being about State control of industry, rather its about countries coming to grips with the reality of a rapidly shifting energy scenario in the world.
They point out China as an example of a country who seems very aware of the unfolding situation and who is taking proactive steps to avoid getting far behind the process of adaptation. In China its true that the government tales a strong role in setting industrial policy, and that their government is dominated at all levels by engineers who achieve rank more by merit than inherited wealth, rather than lawyers, entertainers, or wealthy businessmen as we have in this country.
Regardless, robust electricity supply and system as a source national economic strength is the main point of the article. Electricity as a basis for currency is a concept worth considering. Better than the thin air upon which currency is based in much of world.
On China- a very interesting book was written by an American of Chinese heritage named Dan Wang, that came out this year with lots of good interviews and articles about it.
from the author here is a short perspective-
https://danwang.co/breakneck/
I am not a proponent of Chinese (or any other autocracy) by any means, but I certainly greatly admire the collective accomplishments of the country since I was a kid. Astounding!!!
I think we would all like some sort of pragmatic and effective governance. I lean hard towards towards democracy but have long wondered if most people are up for the mental challenge it takes to understand issues and make wise decisions about policies and leadership. And also skeptical of most peoples ability to resist coercion and falsehoods. Evidence of past performance ( and current) is very damning on this question.
I caution those who yearn for a tilt towards autocracy to be very careful what you wish for. Maybe spend some time reading about life under that pathos.
https://www.carnegie.org/our-work/article/twenty-lessons-fighting-tyranny/
Hickory,
“ have long wondered if most people are up for the mental challenge it takes to understand issues and make wise decisions about policies and leadership. And also skeptical of most peoples ability to resist coercion and falsehoods”
I agree.
The difference with democracy is that you at least have to convince an electorate to back your policies. That’s clearly not as good as would be ideal, but it’s better than nothing. It helps prevent some of the most completely stupid stuff: good examples of that can be found in China, like the Great Leap Forward, and the policy of forcing intellectuals back to the country.
China has a strong tradition of competent bureacracies, which is basically what we’re seeing now in China with the Communist Party. Competent bureacracies help make a country competent, and buffer the caprices of autocratic leaders.
Which is why Trump is trying so hard to destroy the US’ heretofore competent bureacracy (aka The Deep State).
Behemoth electricity tankers lol
The biggest giveaway in the history of the world, from one country or group to another, has occurred as the USA has wholly ceded energy and transportation and various other emerging tech of the future to China.
Being the coal and oil state will not serve us well, as do our non-competitive giant gas guzzling vehicles. In an open market our automakers would be gone in three..two..one seconds – Gone!
There is one candidate for the biggest traitor to the USA ever.
I present average Permian well profiles normalized to a 10 thousand foot horizontal lateral length for wells with first flow from 2013 to 2020. Wells have the following EUR per 10 kft in cumulative barrels at 190 months for 2013 to 2020:
302663, 357438, 478077, 518037, 510069, 500873, 500462, 490935
The average 2020 well has an EUR/10 kft that is about 5.5% lower than the average 2016 well (491 vs 518 kb/10 kft).
permian well profile 2511
Note that the average 2020 Permian well had an average lateral length of about 9050 feet so the actual new well EUR in 2020 was about 444 kbo at 190 months with output at about 13 bopd for month 190. Normalized EUR is 444*10/9.05=491 kbo at 190 months for the average 2020 Permian well.
On a recent meeting, Exxon chief claim that Exxon invested 60Billion dollars in Guyana to get today’s 850KBOPD capacity since 2015 discovery, not sure if CNOOC and Hess money included. If we count 1 shale lateral as 12million dollars, 60Billion dollars~ 5K laterals in Bakken or Permian. Bakken has ~20K laterals to get 1.2~1.5 MMBOPD, so it is not that huge difference in input cost and return?
Hi Sheng Wu,
There have been about 55 k horizontal wells completed in the Permian as of July 2025. Let’s call it $10 million per well, which is about 550 billion spent for 6000 kbopd. So 550000/6000 is about 92 million per kb/d vs 70 million, so a bit similar, but large upfront costs for deepwater have been spent and ongoing capital spent will be less. Look at 10k to see lower profits from US vs international for XOM, there is a big difference, US E&P operations are very low margin.
From most recent XOM 10Q, for US upstream segment profits were about 8.76% and for non-US upstream it was 32% profits.
China has figured it out. Coal, Coal, Coal. The future is electric power 24/7 at a price that doesn’t bankrupt the peeps. If anyone believes that China gives a damn about carbon dioxide they live in La La land.
Ervin,
Using the Energy Institutes Statistical Review of World Energy 2025
https://www.energyinst.org/statistical-review
From 2023 to 2024 China increased electrical generation by 630 TWh with 82.6% (521 TWh) of this provided by renewables and nuclear power, the increase in electrical generation from coal was only 11.9% (75 TWh). So a little more coal was burned for electricity generation, but most of the increase in power output came from non-fossil fuel sources.
Also in 2024 China produced 34% of all World renewable power output (including hydro) with China producing 3399 TWh and the World producing 9868 TWh of renewable power. Also the average annual rate of growth in renewable power output from 2015 to 2024 was about 9.6% per year.
Ervin
You are absolutely correct.
Last year China burned 4,800 million tonnes of coal. In the last 10 years China has burned as much coal as Europe will do in the next 140 years at current consumption.
Dennis knows nothing about global warming or the cuts required to prevent catastrophic changes from occurring. China by now needed to cut coal consumption by a per capita equivalent of the E.U. In other words, no more than a billion tonnes per year.
There are unfortunately people who can’t face the fact that after 40 years of going in the wrong direction. It is now too late. Mindlessly they keep on saying we can, we can. When this is the reality now.
https://climateandeconomy.com/2025/11/20/20th-november-2025-todays-round-up-of-climate-news/
Droughts are spreading as never before, affecting countries that have never faced these situations.
https://insideclimatenews.org/news/25042020/forest-trees-climate-change-deforestation/
Since this article the world has lost 50 billion more trees to fires and logging.
Ervin, correct me if I am wrong but I think you previously indicated that you are from Pennsylvania. If so, it is ironic to hear you who sits atop the Marcellus shale nat gas mountain clamoring for coal.
You live in a coal town?
Lobby your utility if you want them to go to more coal.
Thanks Dennis, nice report. The NDIC report for September 25 North Dakota production came out today. Daily oil declined about 5000 barrels to 1165903 bopd. Daily gas increased about 45 kmcf/d to 3.579 bcf/d.
The report has a lot of additional info that is interesting. One new trend is how much the Well Cycle Time between spud and stimulation has decreased. It is now down to about 80 days in April 2025 according to their estimate.
Their info on lateral lengths shows how the trends are developing there.
Thanks DCLonghorn. Interesting info on North Dakota, for others see
https://www.dmr.nd.gov/dmr/sites/www/files/documents/Director's%20Cut/DirectorsCut_November2025.pdf
or
https://www.dmr.nd.gov/dmr/oilgas/directorscut
Rig Report for the Week Ending November 21
The rig count drop that started in early April 2025 when 450 rigs were operating rose again this week. Drilling continues at unabated rates with WTI below $60/b.
– US Hz oil rigs added 4 to 371, down 79 since April 2025 when it was 450. It is also up 9 from the low of 362 in the week ending August 1. The rig count is down 17% since April.
– New Mexico Permian added 1 to 96 while Texas was unchanged at 175.
– Texas Permian was unchanged at 136. Midland was unchanged at 24 while Martin added 3 to 24, up 6 from 2 weeks ago.
– In New Mexico Eddy dropped 1 to 37 and Lea added 2 to 59, up 4 from 2 weeks ago.
– Eagle Ford was flat at 28.
– NG Hz rigs rose by 1 to 110.
A Rig
Frac Spread Report for the Week Ending November 21
The frac spread count rose by 4 to 179. From one year ago, it is down 42 and down by 36 spreads since March 28.
A Frac
DC
I don’t argue that China has built and is building power resources other than coal, oil and gas.
But never forget China is a communist country and their leaders since Chairman Mao to today are only concerned, first and foremost, about the power to control the people of their country. I hope I’m wrong with the sense that somehow, you think, they are the good guys
Ervin,
No I don’t think they are good guys. I think governments should be elected by citizens. Socialism is ok with me as long as it is democratic socialism.
A dictatorship of the proletariat? Doesn’t seem to be a problem.
https://docs.google.com/spreadsheets/d/1qlT-lpY0_Dgat8c7Qbey2K7tuPO7jRefpxjtkdw2Wjg/htmlview#gid=482281569
Let’s ask Americans and Europeans what they think of their free democracies and how well it works for them next. The UK and EU are especially funny in light of all the shit being done against what the electorate voted for.
Don’t forget the projection of “China’s an authoritarian surveillance state”.
Thanks for the excellent work Dennis.
Thanks Ian.
kolbeinih
Why do you find it necessary to twist people’s words?
Are you incapable of simply replying to the point they make?
I never said wind and solar are obsolete. You however obviously don’t give a hoot that people are dying from cold in my country. Market stress as you put it is when people die because they can’t heat their homes.
Also I never said wind and solar over 30% causes serious problems. I said costs start to increase. Which they do. Look at the electricity costs in countries.
I never mentioned hydro, obviously countries with a lot of hydro have a natural storage backup, so wind and solar can reduce the use of water up to a point. However reduction of water is not always possible. Do you know why?
Also your statement that Europe is a small part of the economy of the world is rather ignorant. It is an eighth of the world population and has one fifth of the global economy.
The United States is becoming crippled by its debt, having to shut down government, is like a third world country.
https://www.voronoiapp.com/debt/Global-Government-Debt-Soars-to-102T-in-2024–3333
”The United States is becoming crippled by its debt, having to shut down the government, is like a third world country ”
Correct . 42 million on SNAP + 15 million on Food banks and other charities = 60 million i.e 20 % of the population . Any difference between India — 800 million surviving on 5kg wheat/rice + 1 kg chickpeas per person/ per month ? FREE .
Now the creme de brulee from another blog .
”Here in France, town halls and emergency shelters are opening their doors again to take in the homeless and those who can’t afford heating or meals. A familiar ritual, with student lunches served for one euro a day in university cafeterias. Food and energy poverty, à la française.
In the United States they do it differently, and McDonald’s takes the lead — but it’s the same barometer telling us that, despite the CAC 40 and the Vuitton-Hennessy mirage, the economic crisis has already become real.
And somewhere in the fluorescence of the fast-food cathedrals, between the sweet grease of the fries and the monotone hum of the milkshake machines, you can feel the real heartbeat of America. Not the deceitful neural network of Wall Street, but that anonymous line of people inching forward as if participating in a ritual: the sacred transfer of a cardboard bag filled with caloric comfort.
Hunter S. Thompson would have recognized it instantly: that trembling, nervous moment when an empire loses its façade, not through war, but through inflation of the soul. A five-dollar meal isn’t an economic indicator, it’s a panic button. It’s the Big Mac whispering: “Friend, we are deep in the tunnel. The exit is a QR code that doesn’t work.”
You see people ordering as if it might be their last hot meal before the next rate hike. You see them slurp the cola with that particular kind of resignation that only appears when a country is just barely managing to believe in its own story. Behind the counter runs an underpaid crew on Red Bull and desperation, while the corporate office on the 52nd floor of a glass tower insists that “consumer sentiment is stabilizing.”
Stabilizing? Listen closely and you can hear the cracking. Not from the bun, but from the hinges of the American Dream. The whole place runs on debt, hype, and ketchup packets. And above it looms the colossal shadow of AI giants devouring energy like prehistoric beasts, while the average citizen calculates how many days remain until the next paycheck.
MAGA hasn’t solved a thing. But the Big Mac has: it lays the truth bare on a plastic tray. No analyses, no indices, no Powell mumbling that everything is “transitory.” Only that burger staring back at you and saying: The end always begins at the level of fast food.
Hole in head:
That’s the best writing I’ve read on the internet in several years. Hunter S would be proud of you!
I haven’t eaten fast food since the early to mid-early 1980’s.
For many years now DC has indicated that his analysis of oil production data points to peak production in the second half of this decade, much to the consternation of many others who saw that as pipedream thinking. They had trouble imagining that peak production had not already occurred.
Lets acknowledge and applaud the ability to analyze the imperfect incoming data and adjust our thinking to what actually unfolds, rather than what we may believe to be the nature of things…especially the things of man/womenkind.
Great job Dennis!, and thank you (and Ovi!) very much for keeping your eye on the ball and sharing your observations and perspectives with everyone.
Thanks Hickory,
My guess is that my guesses about the future will prove incorrect. Statistically this is very close to certain.
My interpretation of DCs predictions have been a peak with a long plateau.
It looks to me he has been very accurate
and very humble
acknowledging consistently that his predictions will be wrong.
Some people attack him for this, which is unfair IMO.
credit where credit is due.
Thanks Andre,
Over time I have predicted different levels for the plateau and the timing for beginning and end of plateau and decline after the plateau have varied. No scenario has been precisely correct and most have had a peak in the 2020 to 2030 time frame with a rough plateau in the 80 to 85 Mb/d range from 2020 to 2030. The earlier predictions were earlier and lower and as URR has been adjusted higher over time the plateau has been higher with later starts.
https://www.dailymail.co.uk/sciencetech/article-15313731/US-spy-jet-near-Russia-World-War-3-warning.html
US spy plane spotted 60 miles from Black Sea sparks fears of a war escalation.
Russia may be preparing to strike NATO territory.
As I have argued on this site before……..Russia is facing an existential threat demographically (not enough men in 20 year range — youtube Peter Zeihan) and they can’t stop their oil infrastructure from being attacked.
What if Ukraine gets British Storm Shadow or US Tomahawk missiles?
I am not sure that Siberian pipeline infrastructure could be rebuilt???
China to the south already claims parts of Siberia as its own?
Tactical (small yield) nukes <—– Andre predicts 50% chance, to send a message but not enough to start a full scale nuclear war
The DAILY MAIL is on top of it!!!! (lol)
Dennis
Attached is a chart that compares OPEC’s October production with the OPEC + target. Clearly the Big three, SA, UAE and Kuwait are close to their target. The biggest discrepancies are with Iraq and Russia. Iraq might get a boost in November since the Kurdish pipeline has now been reopened. Overall, excluding Kazakhstan’s over production, OPEC + is 312 kb/d below its target.
The OPEC + increases shown in the second column are the same for November and December. There are no production increases scheduled for the first three months of 2026.
The interesting country to watch will be SA. Looking at your SA chart above, it produced 10,000 kb/d for 1 1/2 years starting in January 2017. For December 2025, SA’s target is 10,085 kb/d. The question here is “Is 10,085 kb/d a comfortable long term production level for SA?”
A OPec
Thanks Ovi,
It may be that OPEC Big 4 producers account for the overproduction by Kazakstan and the underproduction by Russia for a net of about 40 kb/d over target in October. Also possible that they all realize the targets are too high relative to the demand for oil and are thus holding back production or they may all be producing at near their maximum sustainable output. We will see how close they come to their targets in November and December.
Ovi,
For Saudi Arabia their centered 12 month output for crude oil was above 10100 kb/d from Feb 2022 to March 2023, so I think they are likely comfortable with that level for long term output. They claim they can produce 12500 kb/d, but until I see that level of sustained output for a minimum of 12 months (average output for 12 months of 12500 kb/d or more) I do not believe these claims. Average Saudi crude oil output from August 2021 to August 2023 was
10184 kb/d.
A cautionary tale for the US on LNG exports from Australia
https://oilprice.com/Energy/Natural-Gas/Australia-A-Global-LNG-Power-Facing-Local-Shortages.html
Dennis,
And what, exactly, is the cautionary tale to be gleaned from Australia’s situation – as described in that article – in relation to the US?
Coffeeguyzz,
Often it is claimed that if LNG production facilities are built, then there must be plenty of natural gas to feed them. The article leaves the impression that Australia may find it difficult to maintain their natural gas output. Australia only has 12 BCF/d of LNG export capacity, so output may just be matching that capacity.
We will see if Australia can maintain its natural gas output, it has been pretty flat for the past 6 years, see chart linked below using data from Statistical Review of World Energy.
I wonder if US natural gas may also be near a plateau, we will see if there will be enough natural gas to keep LNG export facilities operating near 90% capacity.
The cautionary tale is that output does not always increase, the US may be near a plateau in natural gas output, I expect that within 5 years we will see a plateau in US natural gas output.
australia NG
Dennis,
Yeah, your somewhat skeptical inclination vis a vis adequate, long term supply (for US LNG plants) is pretty well recognized.
And, naturally, my contrary view has been oft stated.
The Aussie situation DOES offer several ‘lessons’, IMHO.
As is mentioned throughout that article, numerous regulatory/environmental hurdles continue to exist prompting significant supply constraints … to say nothing of the economic impact (aka rising costs).
Those high costs – weirdly enough – might bring about the importation of US LNG into Port Kembla or the other FSRU terminals in the coming years.
Even though Aussie CSG (Coal Seam Gas – which supplies the Curtis Island LNG plants) is relatively expensive (US $6/$8 mmbtu), there supposedly exists sufficient resource to satisfy Aussie demand for decades to come.
Policy – not geology – is the root issue here.
Cautionary tale for the US fo’ sho’.
Indeed a cautionary tale.
Beetaloo Basin is starting to export its way out of Darwin.
(Out of Northern most part of the continent, for those who haven’t travelled down under)
A potential future shale gas scenario, URR is 900 TCF for dry shale gas (marketed gas URR is about 990 TCF for this scenario.)
This is my best guess, possible URR could be 600 TCF or 1350 TCF, actual URR will be known in the future.
shale gas 2511
Coffeeguyzz,
In the real world there are environmental regulations. Those of us who live here realize this. I don’t harken back to the good old days when the rivers burned due to high levels of pollution and lack of regulations.
This Oilprice.com news writing messed up million with billion m^3 per month?
It is amazing that Bing tells you Australia monthly gas output based on this exact latest oilprice.com report, i.e. 13million per month.
It amazing that Australia export most of its gas as LNG , and has 44.6% electricity generated by coal.
It is also amazing that Australia did not become the new industrial hub in the west, given the huge high quality iron ore and coal mines.
The latest URR for China’s potential undiscovered unproven deep coal gas is 50Trillion cubic meters, or ~1800TCF.
Sheng Wu,
That 13 MM caught my eye also and I had to do a double check on the numbers.
The ‘gas world’ can be confusing with terajoules, cubic meters, kilowatthours, mmbtus, cubic feet, and ‘M’s all over the place.
Another example of how our AI buddies can be misleading despite the extraordinary impact it can have on data gathering.
Re Aussie power generation … that was actually a ‘thing’ on this site awhile back as a staunch Renewable (sic) advocate named Islandboy noted how an Aussie coal plant malfunction caused a grid blackout (2016?).
I questioned that and Dennis’ proddings prompted me to dig very deeply into the entire coal/natgas/wind-solar power generation universe Down Under.
While – tragically, IMHO – the political and ideological components played/still play a huge role in these affairs, the stark consequences should offer powerful object lessons to any open minded observer.
The fact that the bulk of steady, coal fired juice comes from the north – Queensland – and is transmitted through somewhat restricted transfer points into the southern states has caused great disruption potential when intense summer temperatures arise.
An aluminum smelter’s potline freeze up during one of these events caused a months’ long, hundred million dollar shutdown.
One of the big Aussie steel manufacturers – BlueScope – has opened/expanded a plant in Ohio for economically motivated reasons.
Despite having – by far – the world’s largest recoverable uranium reserves – there has been no inclination to build any nuke plants.(although talk of SMRs might change that.)
The Chinese push into Coal Bed methane recovery is fascinating.
Do you think it probable to see big expansion?
Always good to see your posts.
Coffeeguyzz,
The deep coal rock gas in China got more attention from media/high profile academic reporting than real actions — no shale revolutions like US did 20 years ago.
The government estimate for deep coal rock gas in China right now in 2025 is like US EIA estimate for shale gas in 20011, I guess, and although the potential resources is 50 Trillion Cubic Meters (1800TCF), the production forecast is only 5BCFPD by 2035 by the most optimistic leading industry CNPC, and China EIA gives only 3BCFPD by 2035.
CNPC had a super demo field in Erdos basin and 195 laterals most with short 1.5km length at roughly 2km depth had almost 2MMCFPD each lateral average comparable to Marcellus when normalized to unit length in lateral, some already had output over 3BCF and 100% recovery of resources in place. But, there are also failures in Xingjiang and Sichuan where the production tests are not good or consistent. The deep coal rock gas exploration and production so far is not open to private sectors, only the shallow CBMs are open.
Just digged into past EIA annual energy report,
https://www.osti.gov/biblio/1212312
It seems that “shale gas” did not formally enter EIA report till 2010/2011, and still co-mingled with coal-bed methane till 2012?
In 2011 report, EIA has unproven shale gas and CBM at just over 1,000 TCF, and proven tight, shale+CBM at 167TCF.
https://www.osti.gov/servlets/purl/1212312
DC (and CoffeeGuyzz),
Environmental regulations?? One of the Aussie posters here has boasted about about how he dumps his wastewater in the local river. I doubt he has the balls now to speak up and admit it. But yes oil and gas exact a huge toll on the natural environment, even when everything is ‘done right’. Regulars here could, but don’t, share their horror stories of massive pollution.
It’s the giant unspoken secret and shame of this website, the massive environmental destruction being perpetrated by the drillers and miners here.
Got2Surf,
We all play a role in this, many of us have used products of the oil, natural gas and coal industries, probably 99% of us at minimum. Products are produced to fill a need, I agree that environmental damage should be minimized, it is unlikely to be eliminated in the near future and more likely not ever.
Dennis,
The obvious thing here is for everyone to agree to be honest about the external costs of FF: the pollution, the security risks, the inequalities and economic imbalances that periodically threaten to cause wars and recessions, etc. Most of all, the pollution. We need to talk honestly and straightforwardly about polllution and climate change. Wouldn’t that be refreshing?
The other big thing is to acknowledge that individual action is inadequate, it’s nice but wholly inadequate. It’s like basketball: no one can choose to implement a rule against elbowing by themselves, it takes a general rule enforced by a referee. It a makes no sense to complain that people aren’t doing enough on their own, or to feel guilty for not doing the right thing on one’s own: the important thing is to be pushing for general rules (legislation) and enforcement by a referee (government).
Once we agree that we need those two things (honesty and public policy), the rest is easy. Carbon taxes (basically fuel and utility taxes, calculated based on emissions) would provide a proper accounting and incentive for a speedy transition away from FF. Secondary measures would help, lsuch as efficiency regulations (like CAFE).
This isn’t really a difficult technical problem: it’s the politics, and the power of wealthy FF corporations (including those that own mass media), FF exporting countries, and wealthy investors that get in the way.
Anyway…let’s start with honesty about the problems!
Nick,
I agree individual action alone is not enough, voting is an individual action and campaigning and advocating. Policies, laws, and government action are the sum of many individual choices. The individual choices can make a difference. Action or inaction is an individual choice.
I also agree the problem is not a difficult technical problem, it is however a difficult political problem as it has not been solved as of yet.
Dennis,
I agree completely.
I guess the way to put it is that voting by consumer choice isn’t enough, it has to be voting by…voting. It’s easy to say that we should buy EVs and heat pumps, but that has a lot of problems: we can only buy what’s available and many of us have to balance a great number of priorities. We should do what we can in the area of shifting our energy consumption, but the major change has to come from us being active socially and politically: talking to representatives, voting, talking to friends and neighbors and people on blogs….etc.
The cautionary tale from Australia is: don’t believe politicians like the former Prime Minister John Howard who declared Australia an energy super power in 2006
https://www.abc.net.au/news/2006-07-17/howard-outlines-energy-superpower-vision/1803744
Victoria conventional gas production has peaked
http://crudeoilpeak.info/peak-gas-in-victoria-australia
The East Coast gas crisis has lead to higher electricity prices. Since everyone assumes EVs will be the solution, I now follow power supplies:
21 Oct 2025
NSW power generation curves, AEMO lack of reserves and intervention notices September 2025 (part1)
https://crudeoilpeak.info/nsw-power-generation-curves-lack-of-reserves-and-intervention-notices-september-2025-part1
21 Oct 2025
NSW power generation curves, AEMO lack of reserves and intervention notices September 2025 (part2)
https://crudeoilpeak.info/nsw-power-generation-curves-lack-of-reserves-and-intervention-notices-september-2025-part-2
Take this into account-
“JP Morgan Says Oil Prices Could Plunge Into $30s by 2027”
https://oilprice.com/Energy/Oil-Prices/JP-Morgan-Says-Oil-Prices-Could-Plunge-Into-30s-by-2027.html
The new enlarged Russia might be back in the oil supply market next year unhindered by attempts to restrain this current wave of expansionism.
some journalists and financial analysts are both green washed and lack basic accounting/numbers training.
Cop 30
China, Russia and Saudi Arabia have refused to agree to any firm reductions in oil, gas or coal consumption.
It has taken 30 years to show even the most naive, that ruthless governments will never do anything good.
In the year of Cop1. The world consumed 4.8 billion tonnes of coal. To prevent the devastating climate changes we are now seeing a peak no later than 2005 was required. Followed by an annual decline of at least 2% per year.
Global oil consumption needed to peak at a similar timeframe, at around 90mb/d. Followed by an annual decline rate of 1% per year.
This would have allowed for an increase in gas consumption, for heating not plastics, peaking around now.
Plastic production should have peaked 20 years ago unfortunately it has never been higher. The damage it is doing to the environment is only now being understood with micro plastics found in unborn babies. It’s in the fish and meat we eat and even in plants.
https://cdss.berkeley.edu/news/world-without-plastic-pollution-new-paper-shows-its-possible
The reason we are destroying the planet is simple, the rich who own the oil, coal and factories think they are immune.
They buy expensive organic mutton, have triple water filters. They have monitored alarms and air filters. They own land and water rights. They really believe they are protected from everything.
The fossil fuel industry is like any other. It exists because it is profitable.
Iver
I think politics that are neccessary rule the day as of now. That means short term thinking most of the time. To focus on climate (although right) would not mobilise enough has been my thinking for some time.
Does that mean we have a clear direction for the future? Absolutely not.
To blame the rich and ask for a revolution seems a risky proposition. To bring a sport analogy up; the team run itself into the ground and there was no plan B.
lol
Where did I say we need a revolution?
I am simply stating a fact that if a person has tens of millions can insulate themselves from reality.
Fact is everyone who is wealthy has damaged and polluted the most.
https://eia-international.org/blog/is-indonesias-drive-for-self-sufficiency-in-food-and-biofuels-coming-at-the-cost-of-its-precious-forests/
What we need are large taxes on wood and that money put to protecting what’s left and employing people to replant what’s been destroyed.
Large taxes on plastics, this would pay for people to collect the plastics we see on roadsides and in rivers and oceans.
https://theoceancleanup.com/
These solutions need to be scaled thousands of times to start to make a difference.
It is the rich people and companies that oppose such measures.
What’s your solution?
You’re right, young man, life’s a bitch, and then you die.
But as an old guy, some advice: try to smile and enjoy the best that life has to offer.
Good advice Gerry
Futures oil contract for WTI expiring in June 2026 down to about $57/b from
https://www.cmegroup.com/markets/energy/crude-oil/light-sweet-crude.quotes.html
see link below.
futures oil 2511
Reuters had this article recently. Don’t know if it has already been posted.
https://www.reuters.com/business/energy/shale-rigs-idle-layoffs-rise-60-oil-tests-resilience-permian-2025-11-21/
Futures price for June 2026 contract back up to $57.80 by end of Tuesday,
Excellent article well worth reading.
https://substack.com/inbox/post/179721872?utm_campaign=post&triedRedirect=true
LIghtsout,
Yes an interesting article. The focus on oil may be a bit overdone, there are other sources of energy whether it be coal. natural gas, nuclear, hydro, wind, solar, or geothermal. Prices are currently low because there is perceived oversupply of oil, if oil prices rise there will be more investment in oil production that will eventually fill the shortage of supply. In the mean time a high oil price level will lead to higher sales of EVs and possibly transition to natural gas for heavy duty trucking.
The AI demand angle is interesting, personally I try to minimize my use of AI chatbots as I think it is a waste of energy resources. Perhaps these services will require a fee in the future to account for their high energy cost.
If you click on the link to get to the story, then click on the author’s name at the top, it shows a series of long posts, separated by a only a few hours.
Is this an example of AI generated analysis?
Iraq gas flaring
https://projects.unearthed.greenpeace.org/big-oil-iraq/
The gas flared in Iraq could power the entire country.
After 22 years maybe the new contracts will stop this disgraceful waste
I ran across this youtube video explaining how frac’ing is done:
https://www.youtube.com/shorts/huB6g_HDHcM
The animation is done professionally. I’m wondering how accurate it is?
the most incorrect part — no more ceramic proppant.
Ceramic proppant is borrowed from conventional fracking process, only used in earlier Bakken and Haynesville drilling which effectively switched to sand after 2014 price crash.
Then they switch to high quality white sand shipping 100s of miles away, and then local sand — dried and meshed, now local sand wet and not even meshed.
I did a rough calculation of the invariable for EUR % using the Oil Phase Expansion empirical formula.
It turns out that the Low GOR Black Shale oil could have 2~>5 times higher recovery than High GOR LTO.
https://www.linkedin.com/pulse/copy-driving-forces-highly-productive-low-gas-oil-ratio-sheng-wu-fhutc/
New post is up at link below
https://peakoilbarrel.com/short-term-energy-outlook-november-2025/