By Ovi
The focus of this post is an overview of World oil production along with a more detailed review of the top 11 Non-OPEC oil producing countries. OPEC production is covered in a separate post.
Below are a number of Crude plus Condensate (C + C) production charts, usually shortened to “oil”, for oil producing countries. The charts are created from data provided by the EIA’s International Energy Statistics and are updated to May 2024. This is the latest and most detailed/complete World Oil production information available. Information from other sources such as OPEC, the STEO and country specific sites such as Brazil, Norway and China is used to provide a short term outlook.

World oil production decreased by 687 kb/d in May to 81,036 kb/d, green graph. The largest decreases came from Canada 259 kb/d, Saudi Arabai 200 kb/d and Norway 138 kb/d. June’s World oil production is projected to drop by 249 kb/d to 80,787 kb/d.
This chart also projects World C + C production out to December 2025. It uses the September 2024 STEO report along with the International Energy Statistics to make the projection. The red graph forecasts World oil (C + C) production out to December 2025 using the STEO’s September crude oil report.
For December 2025, production is expected to be 84,675 kb/d. It is preceded by a November 2025 peak of 85,236 kb/d. The December 2025 production is 351 kb/d higher than estimated in the previous post.
From June 2024 to December 2025, World oil production is estimated to increase by 3,888 kb/d.
A note of caution. The September STEO is now reporting/forecasting only Crude production which is also shown in the chart. As a result the red C+C graph is a projection based on the crude production graph.
There is a significant change in the ratio (C + C)/C over the last six months of reported crude oil production relative to the previous six months. The average (C + C)/C ratio for the latest 6 months is 0.6% higher than the previous six months. While this is a small difference percentage wise, it makes a significant change to the December 2025 production projection of close to 400 kb/d. Also for May the average has dropped from the previous month. This drop may indicate that this ratio has a seasonal component. The red graph uses the average for last six months of data to make this forecast. This report will now use a fixed latest six month average going forward to try to detect any seasonal variation in the ratio.
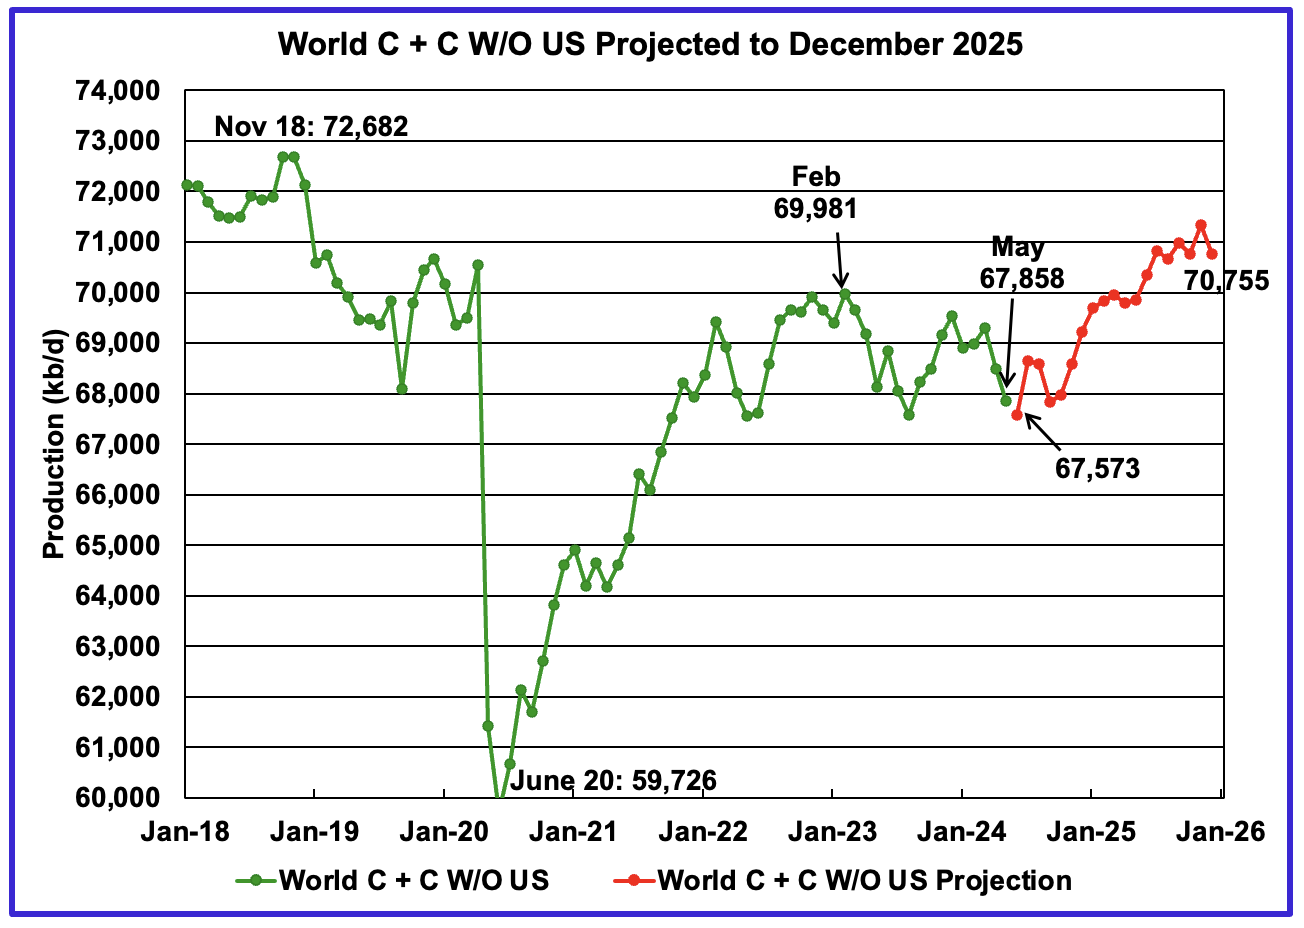
World without US May oil output decreased by 626 kb/d to 67,858 kb/d. June production is expected to drop by 285 kb/d to 67,573 kb/d.
Note that December 2025 output of 70,755 kb/d is 1,927 kb/d lower than the November 2018 peak of 72,682 kb/d. The December 2025 production of 70,755 is also 107 kb/d lower than reported in the previous post.
World oil production W/O the U.S. from June 2024 to December 2025 is forecast to increase by a total of 3,182 kb/d.
A Different Perspective on World Oil Production
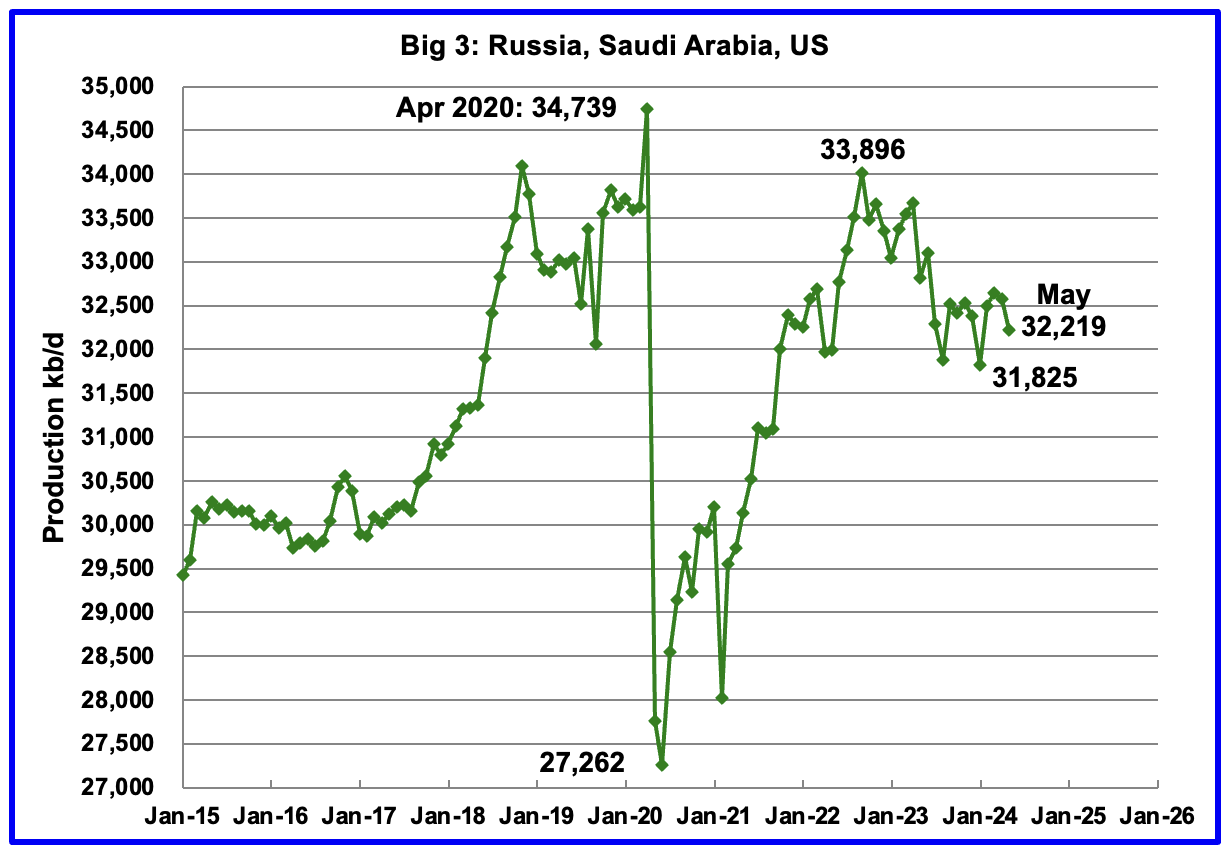
Peak production in the Big 3 occurred in April 2020 at a rate of 34,739 kb/d. The peak was associated with a large production increase from Saudi Arabia. Post covid, production peaked at 33,896 kb/d in September 2022. The production drop since then is primarily due to cutbacks/decline in Russia and Saudi Arabia.
May’s Big 3 oil production decreased by 361 kb/d to 32,219 kb/d. May’s production is 1,677 kb/d lower than the September 2022 post pandemic high of 33,896 kb/d. The countries with the biggest drops were Canada, Norway and Russia.
Adding in the current Saudi Arabia 1,000 kb/d cut would raise production to 33,219 kb/d, just 677 kb/d lower than September 2022 production. Saudi Arabia along with other OPEC + countries which were scheduled to reverse their cuts in October 2024 have now delayed them to December 2024 because of lower Chinese demand.
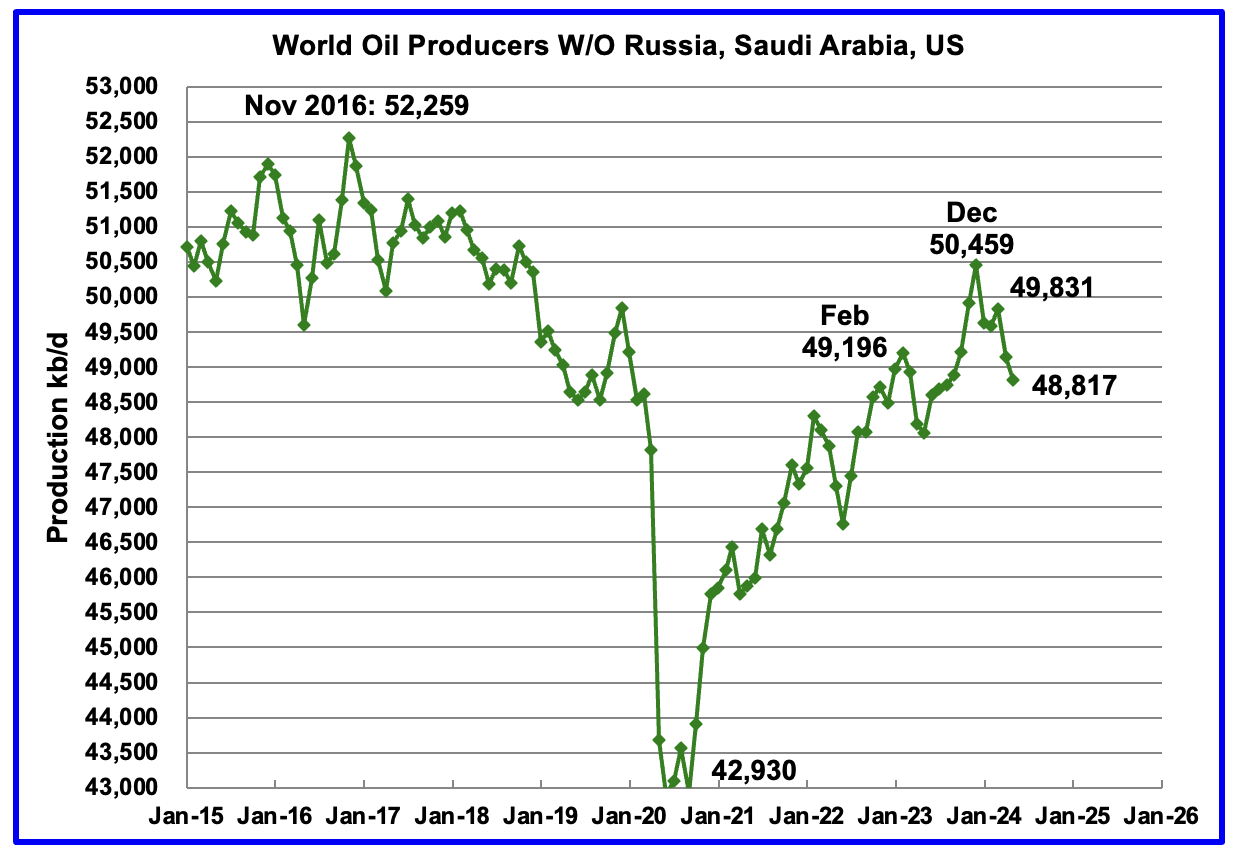
Production in the Remaining Countries had been slowly increasing since the September 2020 low of 42,930 kb/d. Output in December 2023 reached 50,459 kb/d, a new post covid high. However production began to fall in January 2024. May’s production decreased by an additional 326 kb/d to 48,817 kb/d. Of the 326 kb/d, Canada contributed 259 kb/d. The overall drop from December 2023 is 1,642 kb/d.
Countries Ranked by Oil Production
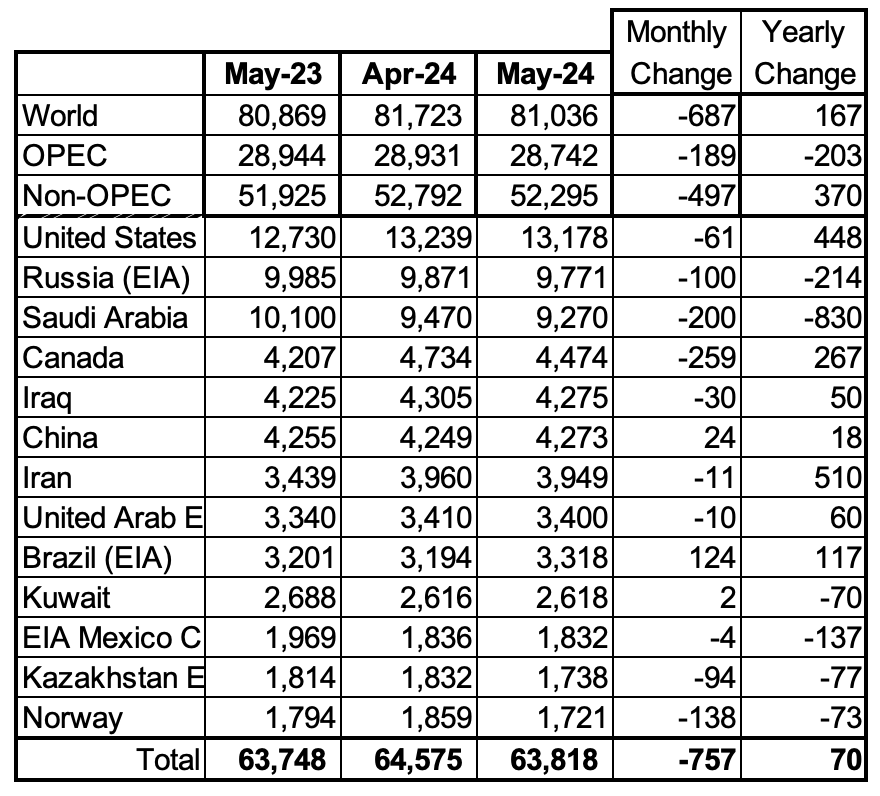
Above are listed the World’s 13th largest oil producing countries. In May 2024, these 13 countries produced 78.7% of the World’s oil. On a MoM basis, production decreased by 757 kb/d in these 13 countries while on a YOY basis, production rose by 70 kb/d.
Note the large and very similar YoY increase in Iranian and US oil production, 510 kb/d vs 448 kb/d.
May Non-OPEC Oil Production Charts
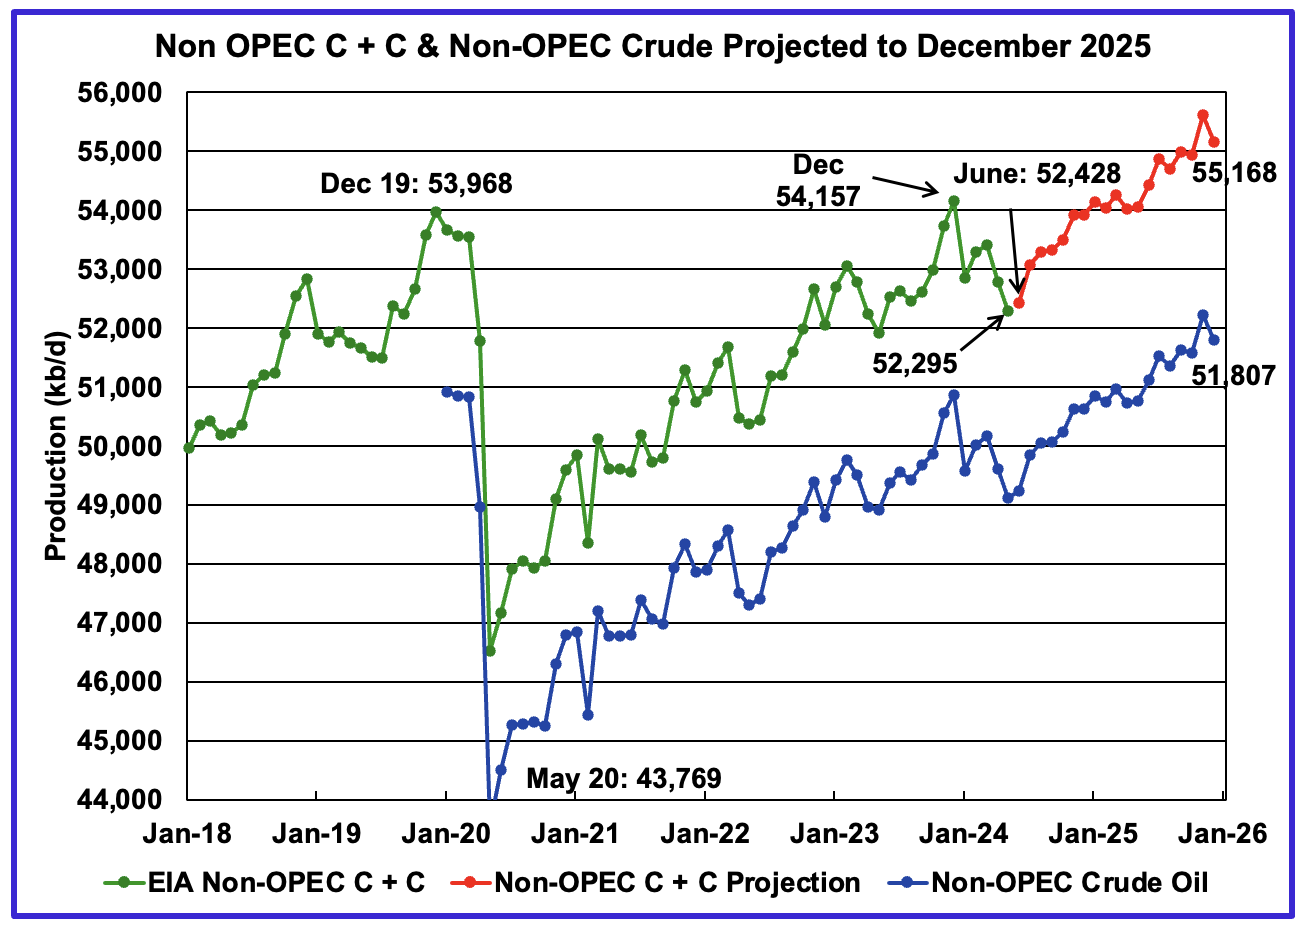
May Non-OPEC oil production decreased by 497 kb/d to 52,295 kb/d. The largest decreases came from Canada and Norway. Note that Non-OPEC production now includes Angola.
Using data from the September 2023 STEO, a projection for Non-OPEC oil output was made for the period June 2024 to December 2025. (Red graph). Output is expected to reach 55,168 kb/d in December 2025, which is 1,200 kb/d higher than the December 2019 peak of 53,968 kb/d.
The same caution as noted in the comments for the World chart above apply to this chart.
From December 2023 to December 2025, oil production in Non-OPEC countries is expected to increase by 1,011 kb/d.
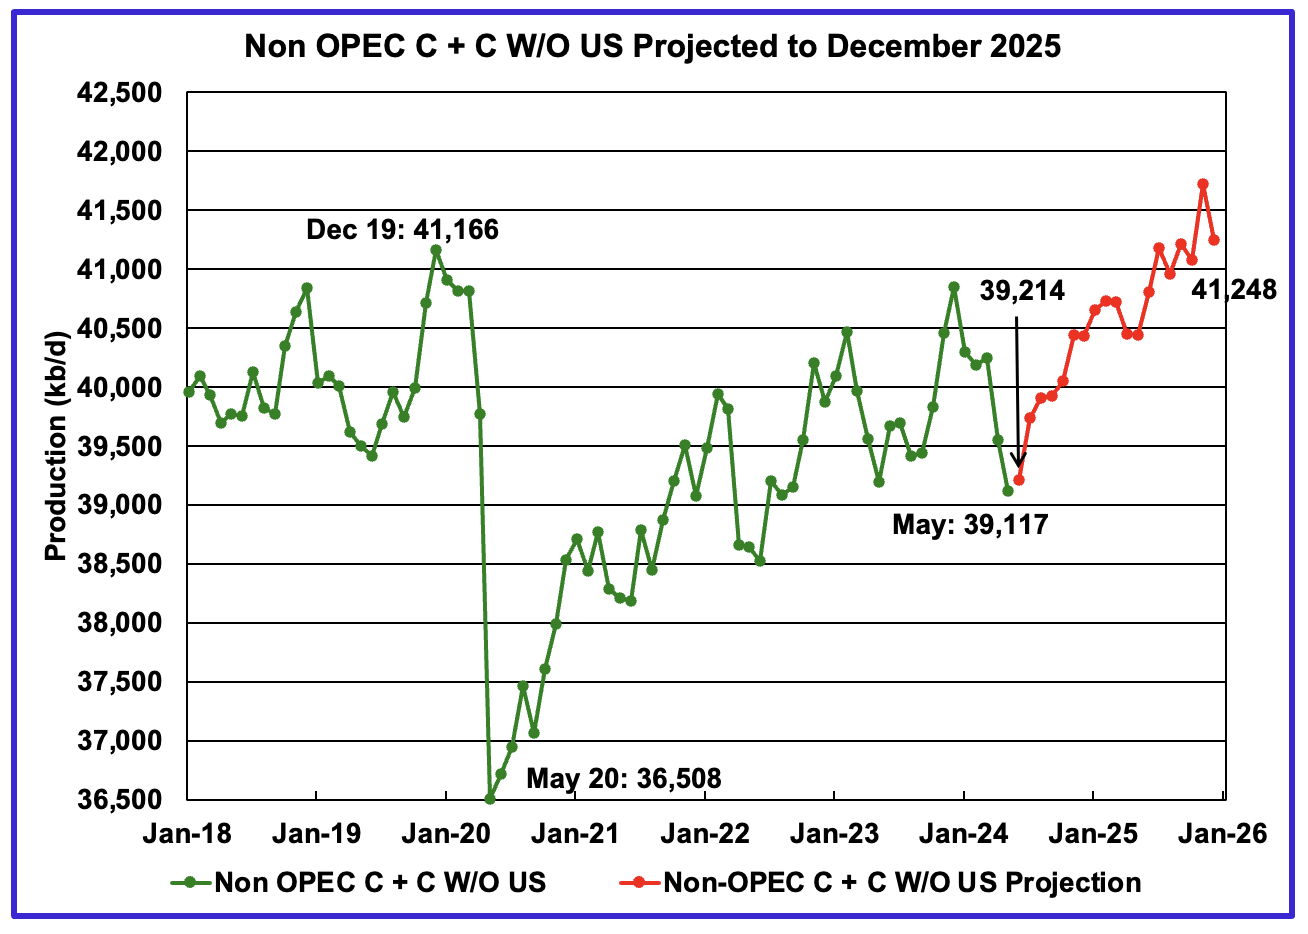
May Non-OPEC W/O US production decreased by 436 kb/d to 39,117 kb/d. June’s production is projected to rise by 97 kb/d to 39,117 kb/d.
From June 2024 to December 2025, production in Non-OPEC countries W/O the US is expected to increase by 2,131 kb/d. December 2025 production is projected to be 82 kb/d higher than December 2019.
Non-OPEC Oil Countries Ranked by Production
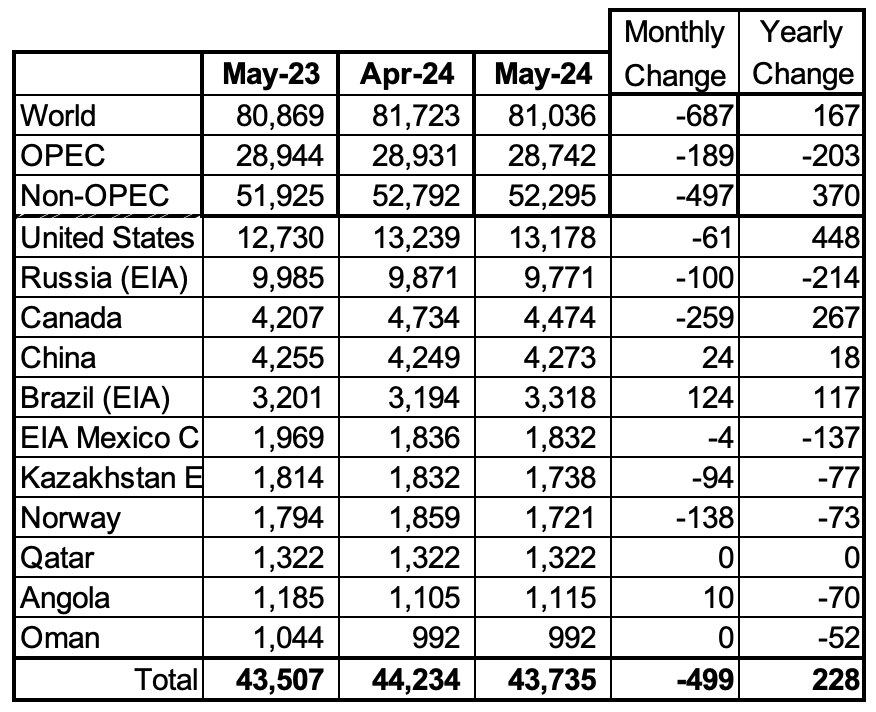
Listed above are the World’s 11 largest Non-OPEC producers. The criteria for inclusion in the table is that all of the countries produce more than 1,000 kb/d. Note that Angola has been added to this table.
May’s production decreased by 499 kb/d to 43,735 kb/d for these eleven Non-OPEC countries while as a whole the Non-OPEC countries saw a monthly production decrease of 497 kb/d.
In May 2024, these 11 countries produced 83.6% of all Non-OPEC oil production.
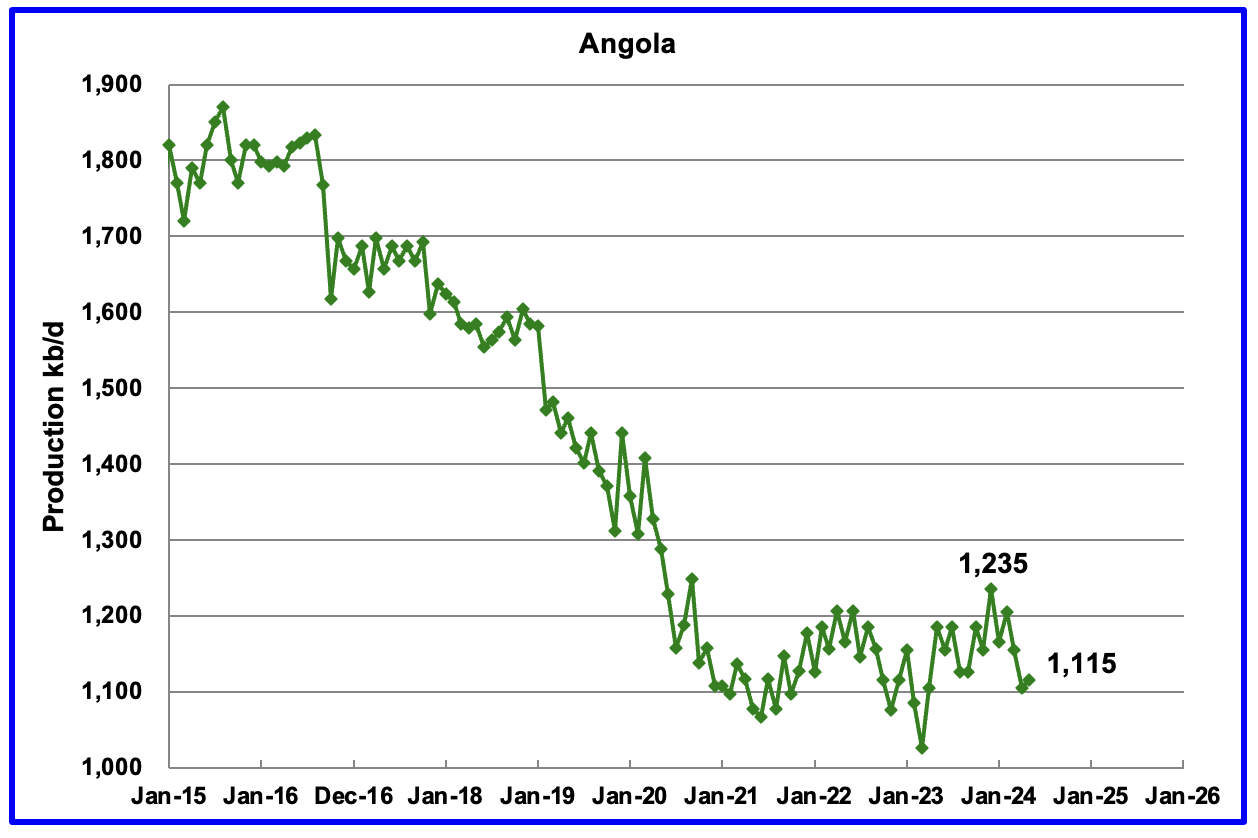
Angola has been added to the Non-OPEC producing countries since they withdrew from OPEC.
Angola’s May production increased by 10 kb/d to 1,115 kb/d. Angola’s production since early 2022 appears to have settled into a plateau phase.

The EIA reported that Brazil’s May production rose by 124 kb/d to 3,318 kb/d.
Brazil’s National Petroleum Association (BNPA) reported that production increased in June by 91 kb/d but had a significant drop in July to 3,260 kb/d. The BNPA has begun reporting Brazil’s pre-salt production again. The August pre-salt report reflects the crude oil pattern. For July, pre-salt production was down by 125 kb/d.
The drop in production up to April was primarily due to extensive maintenance and production is expected to recover to previous levels going forward. According to OPEC: “The Brazilian state-controlled Petrobras FPSO unit, Maria Quiteria, is expected to start production in 4Q24 – earlier than previously expected – following its deployment at the Parque das Baleias integrated project.
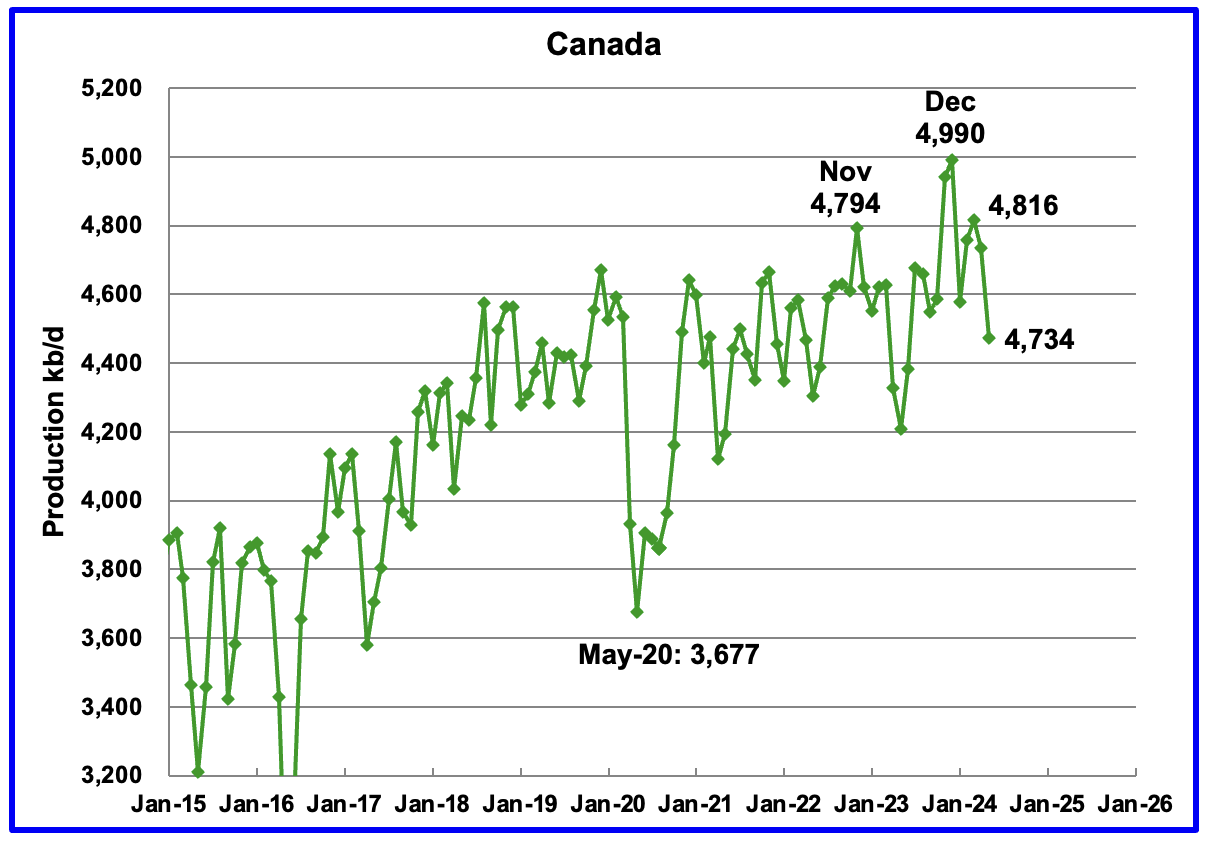
Canada’s production decreased by 259 kb/d in May to 4,474 kb/d. The drop is primarily due to maintenance at oil sands plants.
According to this article, a lot of maintenance was planned for Q2.
“This year the maintenance season is average, union representatives said, and will peak in the second quarter with around 238,000 barrels per day of oil sands production being taken offline.”
According to this article, the TMX pipeline has given Canada the opportunity to compete with Middle East crudes in the China/Asia economy.
“The recently expanded 590,000 b/d Trans Mountain Expansion (TMX) pipeline’s start-up has improved Asian refiners’ access to heavy Canadian crude at a time when supplies of such grades have tightened, PetroChina International’s chief economist Wu Qiunan said.
The TMX pipeline has cut the shipping time to export crude from Canada’s west coast to Asia-Pacific to “only 19 days compared with the US Gulf [coast] which is basically 45 days,” Wu said at the S&P Global Commodity Insights Appec conference in Singapore on 9 September. This “opens a very good option for Asia to receive more from Canada”.

The EIA reported China’s oil output in April increased by 24 kb/d to 4,273 kb/d.
The China National Bureau of Statistics reported production for June and July. June added 94 kb/d to 4,367 kb/d and July dropped by 152 to 4,215 kb/d. June production is just 41 kb/d short of the previous June 2015 high of 4,408 kb/d.
According to OPEC, for 2024 “Natural decline rates are anticipated to be offset by additional growth through more infill wells and EOR projects. Chinese majors are set to maintain high upstream Capex in 2024 to meet the growth requirements stated in the 2019 Seven-Year Exploration and Production Increase Action Plan.”
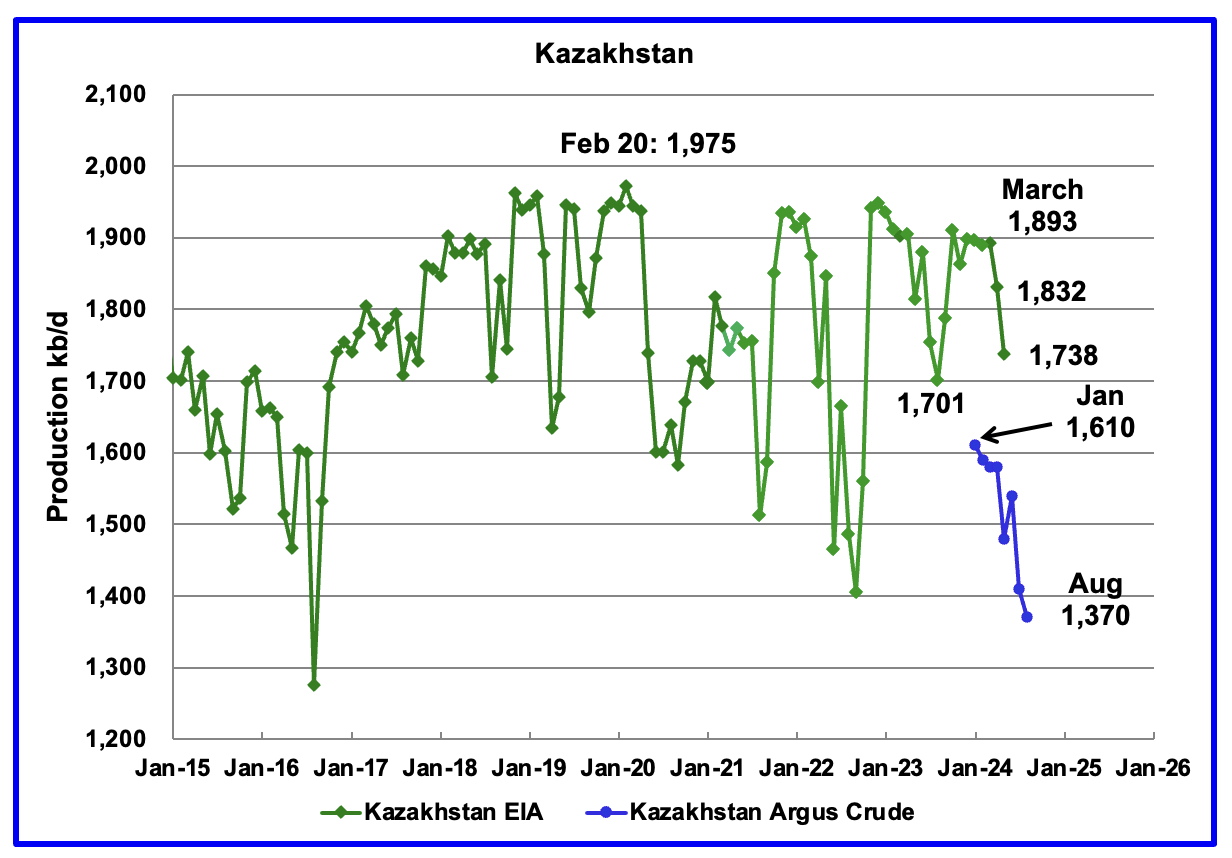
According to the EIA, Kazakhstan’s oil output decreased by 91 kb/d in May to 1,738 kb/d. Kazakhstan’s recent crude oil production, as reported by Argus, has been added to the chart. In August crude production dropped by 40 kb/d to 1,370 kb/d.
Since January, Kazakhstan crude production has dropped by 240 kb/d to 1,370 kb/d. Their production target is 1,470 kb/d. At 1,370 kb/d, Kazakhstan is exceeding its target by producing 100 kb/d less than is permitted. This lower production is intended to offset those times when they were exceeding their target by over producing.
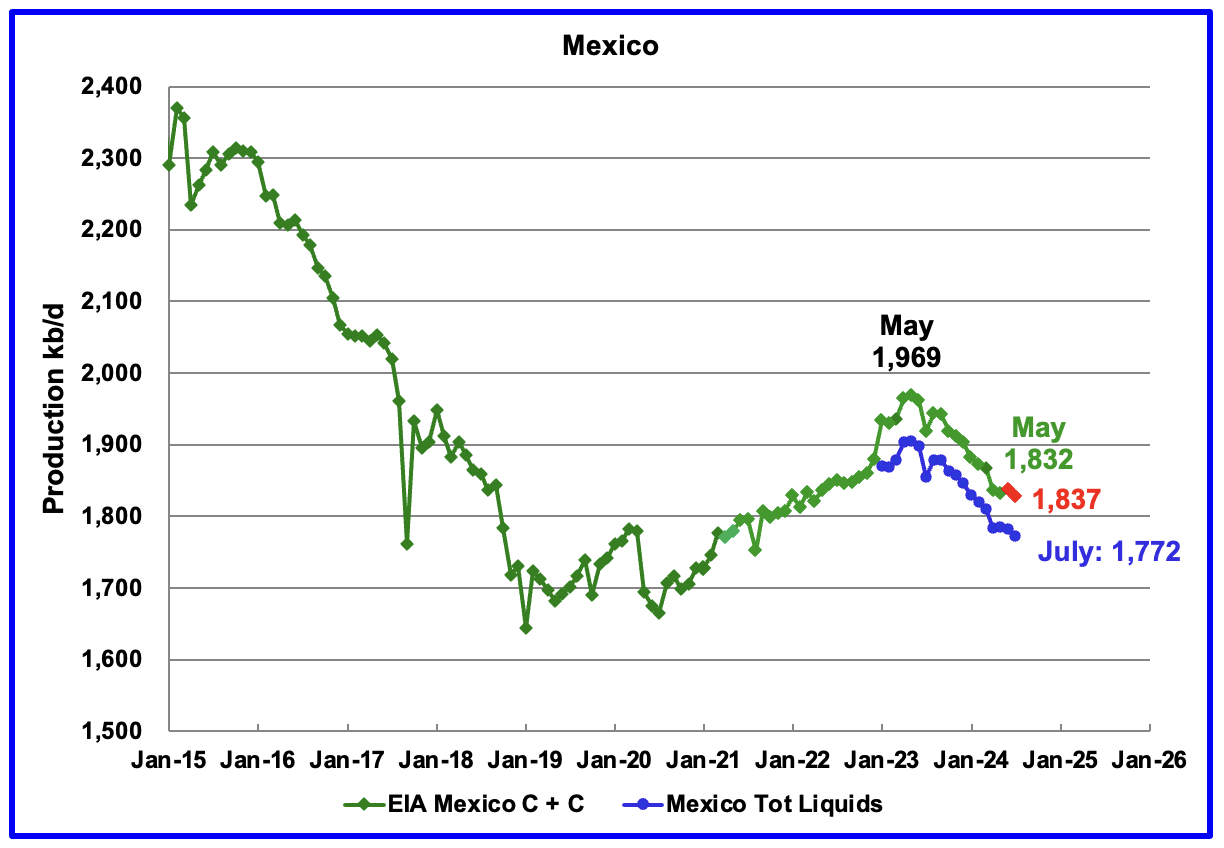
According to the EIA, Mexico’s output decreased by 4 kb/d in May to 1,832 kb/d.
For June, Pemex issued a new and modified oil production report for Heavy, Light and Extra Light oil. It is shown in blue in the chart and it appears that Mexico is not reporting condensate production when compared to the EIA report.
In earlier reports, the EIA would add close to 55 kb/d to the Pemex report. The gap between the EIA report and Pemex on average has been close to 55 kb/d over the last 6 months. Condensate of 55 kb/d has been added to the Pemex report to estimate Mexico’s June production of C + C 1,837 kb/d, red markers.

The EIA reported Norway’s May’s production decreased by 129 kb/d to 1,721 kb/d.
Separately, the Norway Petroleum Directorate (NPD) reported that June’s production increased by 17 kb/d to 1,738 kb/d and July added 107 kb/d to 1,845 kb/d, red markers.
The Norway Petroleum Directorship stated that July’s production is 6.0% more than forecast and 2.7% more than the forecast so far this year.
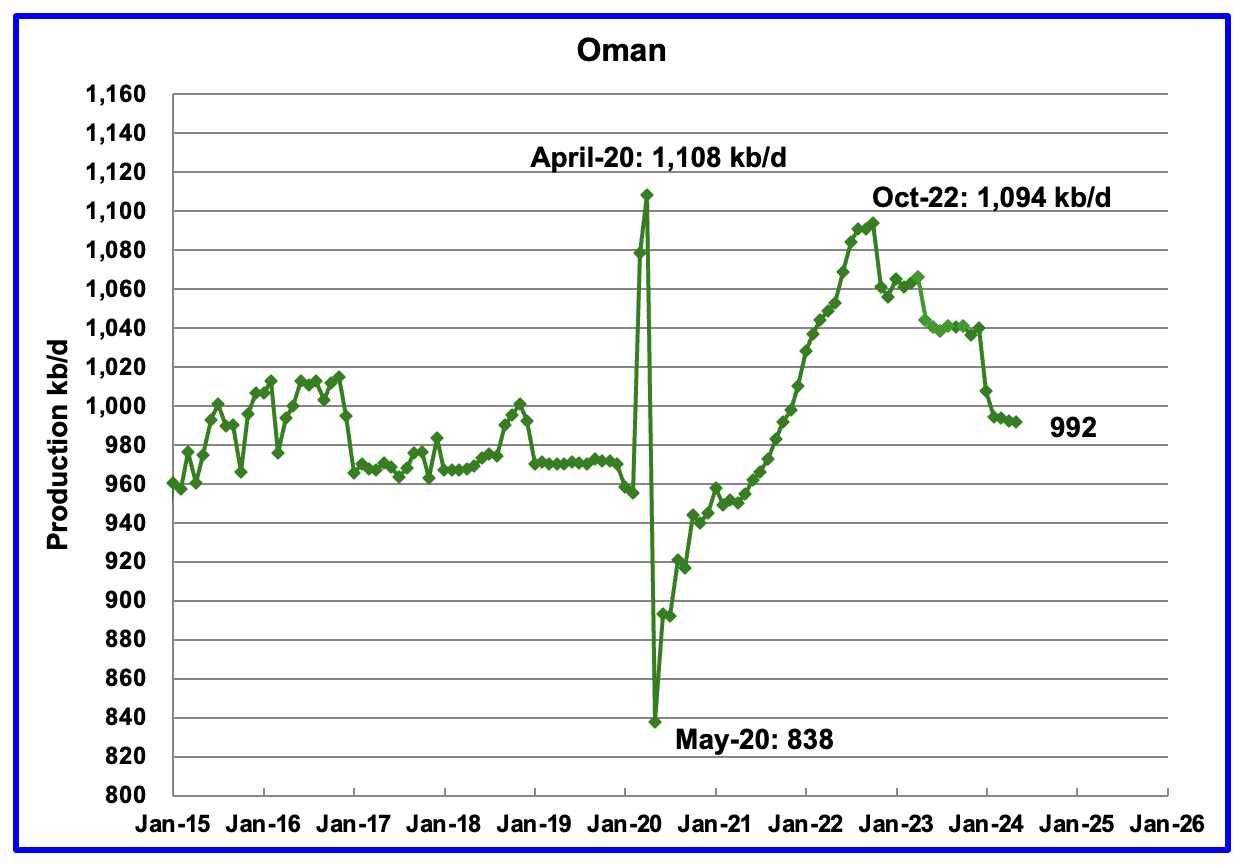
Oman’s production has risen very consistently since the low of May 2020. However production began to drop in November 2022. According to the EIA, May’s output was unchanged at 992 kb/d.
Oman produces a lot of condensate. The OPEC MOMR reports that crude production in June was 766 kb/d, 226 kb/d lower than the EIA’s C + C.
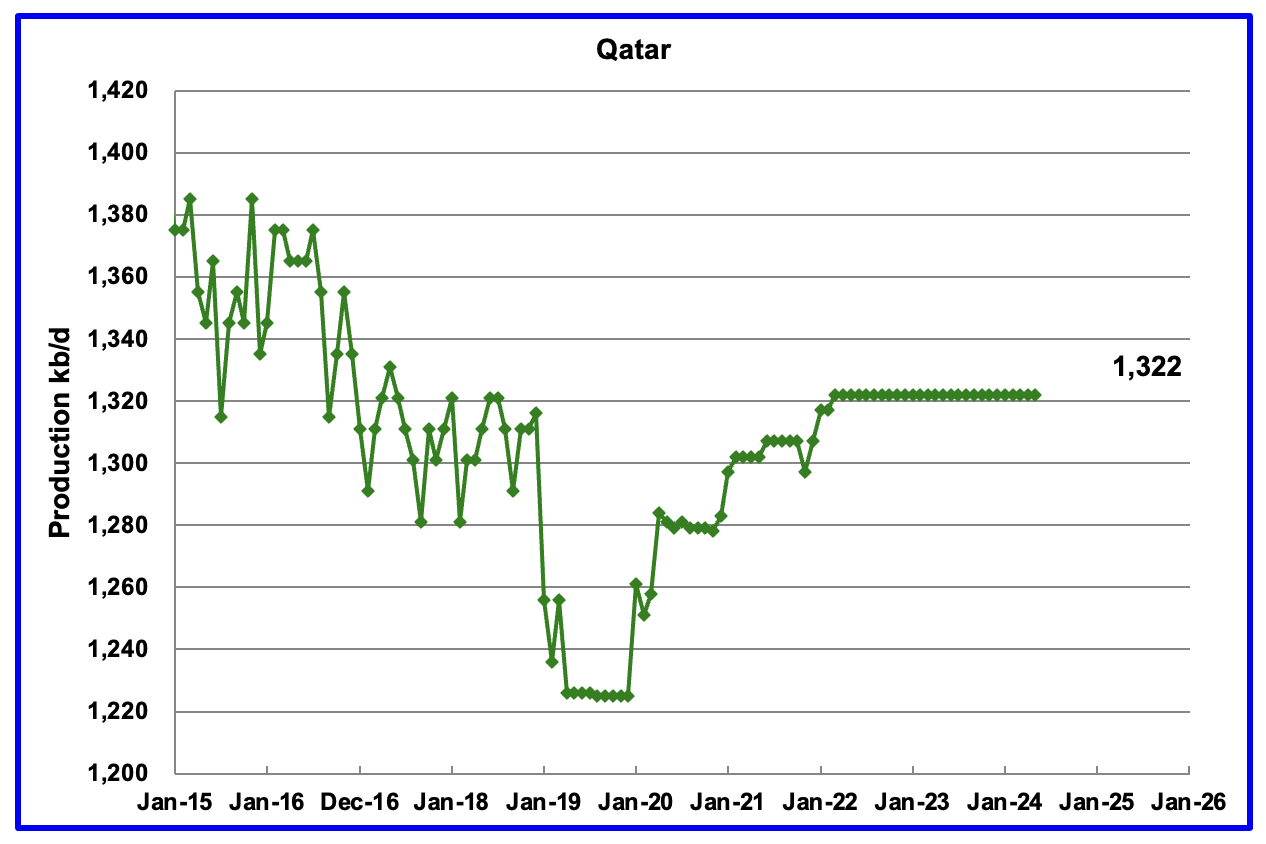
Qatar’s May output was unchanged at 1,322 kb/d, possibly due to lack of updated information.
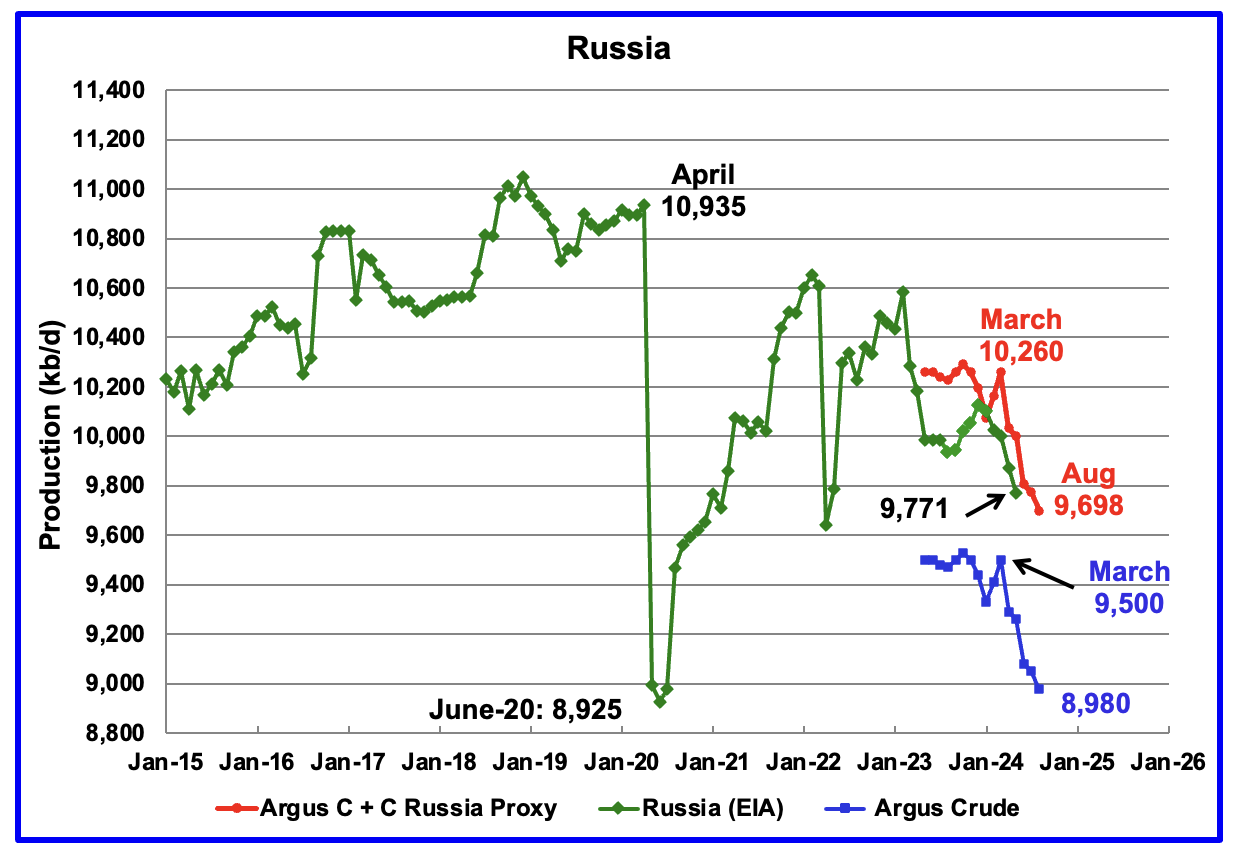
The EIA reported Russia’s May’s C + C production dropped by 100 kb/d to 9,771 kb/d.
Using data from Argus Media reports, Russian crude production is shown from May 2023 to August 2024. For August 2024, Argus reported Russian crude production was 8,980 kb/d, a decrease of 70 kb/d from July, blue markers. Adding 8% to Argus’ August crude production provides a C + C production estimate of 9,698 kb/d for Russia, which is a proxy for the Pre-War Russian Ministry estimate, red markers.
According to Argus, Russian crude production of 8,978 kb/d is essentially in compliance with their OPEC target of 8,980 kb/d.
In pre-war times, the Russia Energy Ministry production estimate used to be 400 kb/d higher than the EIA estimate. For May, the Argus proxy estimate is 230 kb/d higher.
“S & P Platts reports that Russian August crude production was 9,050 kb/d, lower by 50 kb/d from July. Platts’ August production is 70 kb/d higher than reported by the Argus report.
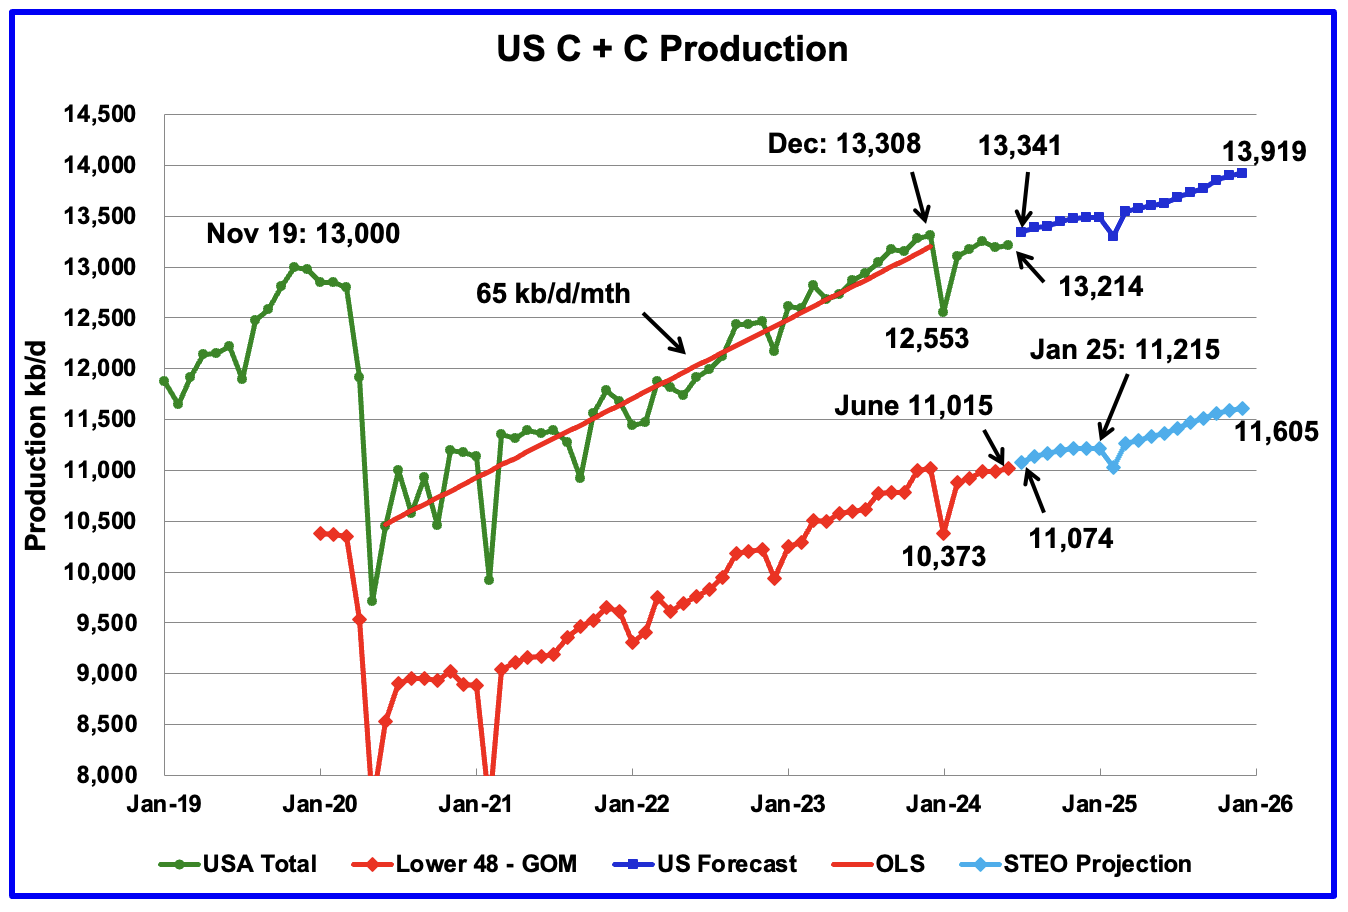
This chart is almost the same as the one posted in the US June update except that the light and dark blue graphs have been updated with almost negligible changes using the September STEO.
I just did this post:
12 Sep 2024
OPEC 12 peak 2016-2018
https://crudeoilpeak.info/opec12-peak-2016-2018
We have to assume that the quotas have the function to cover up production problems
The Wuhan virus acted like a big peak oil crisis
10 Mar 2020
Impact of Corona Virus similar to some earlier peak oil scenarios
http://crudeoilpeak.info/impact-of-corona-virus-similar-to-some-earlier-peak-oil-scenarios
In 2021-22 governments were fed up with restrictions and stimulated the economy.
Result high oil prices in mid 2022. Further damage to the economy which show up now.
High oil prices are always followed with contraction in economy which lowers oil prices. We are in this period now.
Matt,
Not much evidence of economic contraction at the World level and prices rose in 2022 due to Russia’s invasion of Ukraine and the disruption of energy markets that resulted.
Excellent post Matt. The displays of trend are top notch, as always.
The oil prices over the last several years are not high enough to cause a recession. The higher prices of 2022 lasted less than 6 months and were not at a magnitude that would foster a recession given their brevity.
The global economy is slowing due to:
1. Global monetary policies of interest rate hikes that were entirely intended to slow economic growth.
2. A natural return to the base line of slow, steady economic growth of the 2010s.
There are also factors that make higher oil prices more manageable compared to the past like increasing fuel efficiency, higher wages and the fact that there are over 40 million EVs globally, which is increasing by over 15 million per year.
The economic data does not indicate the world is in a recession and we’ve had lower oil prices doer over 2 years now. Historically, a recession would have shown up several quarters ago, soon after oil prices peaked. That did not happen.
IEA is now predicting World oil demand growth of 900 kb/d in 2024 and 950 kb/d in 2025.
https://www.iea.org/reports/oil-market-report-september-2024
and
https://oilprice.com/Energy/Crude-Oil/IEA-Slashes-Oil-Demand-Growth-Forecast.html
In the most recent STEO from the EIA they predict World oil demand growth of 940 kb/d in 2024 and 1520 kb/d in 2025.
OPEC predicts a 2 Mb/d increase in World oil demand in 2024 and 1.7 Mb/d in 2025.
Combining the 2024 plus 2025 estimates for each of these agencies we get
IEA predicts 1.85 Mb/d World oil demand growth from end 2023 to end 2025, EIA predicts 2.46 Mb/d World oil demand growth from end 2023 to end 2025, and OPEC predicts 3.7 Mb/d World oil demand growth from end 2023 to end 2025. In my mind the OPEC estimate is absurd, probably the average of the IEA and EIA estimate is reasonable (2.155 Mb/d growth over two years or about 1.08 Mb/d annual rate of growth in World oil demand).
Dennis
I agree the best thing to do is to take the average of the three agencies.
What was interesting in the IEA report was the July stock draw down. “Global observed oil stocks declined by 47.1 mb in July. The drawdown was concentrated in crude oil, NGLs and feedstocks (-75.5 mb), while oil products built to their highest level since January 2021.
This seems to imply that crude demand was bigger than supply in July. There was also a small 26 Mb draw in June.
Maybe supply and demand are coming into balance. WTI has strengthened over the last few days on this info.
Ovi,
To clarify, I think the OPEC estimate should be ignored. The average of EIA and IEA makes more sense.
If we look at historical estimates from 1980 to 2023 for EIA and OPEC, the OPEC estimates are actually lower than the of EIA, the forecasts of future oil demand by OPEC are much too high. This is just wishful thinking by OPEC.
Averaging predictions is a good idea. You can also weight your averages based on past accuracy.
In the past some here have scoffed at mentions of Nambia oil potential. Some day they are going to show up on the list of significant producers, like Argentina or Guyana.
“As of 2023, estimates place Namibia’s proven and probable (2P) reserves at around 11 billion barrels of oil equivalent. This figure is expected to grow as further exploration and appraisal activities are conducted. With the recent discoveries, the country is projected to start producing oil as early as 2026. Initial production estimates range from 120,000 to 250,000 barrels per day, with the potential to ramp up to 500,000 barrels per day or more in the long term. However, the development of Namibia’s oil resources will not be without challenges. The country’s offshore fields are located in deep water, at depths of up to 3,000 meters, which adds complexity and cost to extraction. Additionally, Namibia will need to build the necessary infrastructure, including pipelines and export terminals, to transport and sell its oil. The estimated cost of developing these fields is in the tens of billions of dollars.”
Incidentally, they have massive solar and wind energy reserves. Like Argentina.
OVI wonderful presentation thanks for sharing with us.
DC
Thanks. Much appreciated.
Ovi,
Firstly thanks for the invaluable report and data presentation.
I had two questions:
1- From June 2024 to December 2025, World oil production is estimated to increase by 3,888 kb/d.
What is your view on this ? Do you think its a reasonable prediction ?
2- the ratio of (c+c)/c
An increase in the ratio implies more condensate production compared to crude.
Has this been increasing overtime ?
This was a question I was going to ask. It seems patently absurd. I think half of that is probably absurd.
Iron Mike
Thanks. Much appreciated
?1: I think that there are 2.5 Mb/d almost guaranteed within OPEC between Saudi Arabia 1.25 Mb/d, UAE 0.75 Mb/d, Kuwait 0.25 Mb/d and Iraq 0.25 Mb/d. Brazil, Guyana. Argentina and Canada could supply another 0.5. So I can see 3.0 Mb/d on the plus side. The unknown is the decline. Russia seems to be in decline. A few more months of data will show whether they are cutting back to meet their OPEC plus target or is their production drop related to real decline. Mexico and Oman are also in decline. Also if you compare the World increase with and without the US you will see that 700 kb/d are from the US. That is the hard one for me to believe.
So bottom line, my best guess at this time, a more realistic potential increase is closer to 2 Mb/d, if demand picks up to require that increased production.
?2: Attached is a chart that show (C + C)/C. As you can see there has been an increase in the ratio since July 2021. However it appears that it spent most of its time since January 2022 between 1.062 to 1/064. The six month moving average shows it has some cyclicalality to it and that is why I chose the six month average. For May the six month average has moved above the monthly ratio.
Ovi,
Thanks for your views, sounds reasonable to me.
Regarding the (c+c)/c, do you by any chance have a longer timeline of that data ? Also with U.S production ? I’ll be curious to see that if you have that available.
Thanks
Iron Mike
With regard to (C plus C)/C, that is the only data I have because the STEO only has provided crude data back to 2020.
The EIA has always published C plus C as far as I am aware. So I don’t have the ratio you are requesting. However I have something else that might provide a clue.
I keep a weekly record of Crude production and NGLs and the associated ratio NGLs/(C plus C) using data from the weekly Petroleum Status Report. While we know these weekly numbers are reasonable estimates, over a long period of time a trend should develop if one exists. The NGLs are a mix of butane, propane, pentane and condensate.
Attached is a chart which shows the trend from July 2020 to early September 2024.
Ovi,
Just to be clear. Excuse my ignorance on the topic. Is it:
Crude + Condensate / Crude ? I would logically deduce that’s what it is.
I am curious to know the energy density of crude vs condensate. I would assume condensate has less energy density (conjecture), hence the increase in (c+c)/c would be interesting to quantify in terms of energy density.
Regarding your interesting plot. The variance is quite high but the trend is obvious. Again it would be interesting to see it in terms of energy density, once again i assume NGLs would have lower energy density than crude.
Interesting stuff.
Iron Mike
It is crucial that the brackets are there. The bracket is calculated first.
“(Crude Condensate)/ Crude ? I would logically deduce that’s what it is.”
Here is a quote from the internet
“While propane generally costs less than diesel or gasoline, it has a lower energy density. Diesel has an energy density of 35.8 megajoules per liter (MJ/L), and gasoline has an energy density of 34.2 MJ/L). Propane, however, only has an energy density of 26 MJ/L, almost a third less of that of diesel and gasoline.”
In general higher density fuels contain more energy per litre
Correction
“(Crude + Condensate)/ Crude ? I would logically deduce that’s what it is.”
Somehow the plus vanished.
Ovi,
I think when a message is edited the plus disappears unless you delete the comment and paste it in a new message.
It would be interesting to see the ratio increase for world production, as that would equate to more condensate production overtime, which also means less energy provided to the economy.
Iron Mike,
The STEO has data for crude back to Jan 1997, but the data looks a little funky prior to 2003. The chart below looks at the C plus C to crude oil ratio for the World from Jan 2005 to May 2024 and presents the centered 12 month average of the C plus C to crude ratio over that period.
Dennis,
Thanks for that. There is an obvious increase albeit a slow one. Is it a fair assumption that as oil fields age the condensate production increases ? Or is purely dependent on the specific oil field ?
Iron Mike,
Not really sure, my guess is that growth in World natural gas output leads to a higher ratio of condensate to crude as much of the condensate comes from natural gas wells. I am not a geophysicist and my knowledge of physics is at the BS level (my last physics course was about 40 years ago). Chart below has World minus US (C plus C)/C and includes CTMA (light blue). Note the strange estimate around 2000 where ratio is less than one which is not possible.
The forecast below uses the EIA’s forecast for US C C and assumes the most recent 12 month average (C plus C) to crude ratio for World minus US remains constant at most recent 12 month average from June 2024 to December 2025. The centered 12 month average is also shown.
Note that this forecast does not look realistic to me, particularly the 3000 kb/d increase from November 2024 to November 2025.
My guess for average World C plus C output in 2025 is 82500 kb/d, roughly 1460 kb/d less than the EIA’s STEO forecast.
It seems drilling currencies goes faster than drilling oil. That would be a nice chart, wouldn’t it?
https://www.youtube.com/watch?v=Vdp77ifHEX8
5 minutes
The self inflicted wound of Mexican energy
Please note: Zeihan ( A geo-political guy not a geologist ) speculates that PEMEX is so incompetent that there is lots of potential for more discoveries in Cantarell field.
PEMEX was basically managing a gusher. Now it takes talent to get the rest out.
The Rig Report for the Week Ending September 13
– US Hz oil rigs added 4 to 441 and are down 18 rigs from April 19. They are up 14 from 8 weeks ago and may be at the beginning of a rising trend. Surprising with WTI just below $70/b
– The Texas rig count dropped by 2 to 237.
– Texas Permian rigs dropped by 1 to 193 while the New Mexico Permian added 1 to 100.
– In New Mexico, Lea was unchanged at 52 rigs while Eddy rose by 1 to 47.
– In Texas, Midland and Martin were both flat at 23 and 31 rigs respectively.
– Eagle Ford was unchanged at 41
– NG Hz rigs dropped by 1 to 81, down 19 from 100 in March. (Not shown).
Frac Spread Report for the Week Ending September 13
The frac spread count rose by 10 to 230. It is also down by 34 from one year ago and down by 38 spreads since March 8.
Peak Oil: A Looming Threat to Economic Stability
World crude oil extraction reached an all-time high of 84.6 million barrels per day in late 2018, and production hasn’t been able to regain that level since then, sparking the question: has oil production already peaked?
lower prices seem to be associated with lower production because extraction has become less profitable for producers. A temporary spike in oil prices does little to raise production. The view of economists that crude oil extraction can continue to rise indefinitely because lower production leads to higher prices, which in turn leads to greater production, is not true. (Economists also believe that substitutes can be helpful, but this is not a subject I will try to cover in this post.)
An alternative story is that the World real economy has continued to grow at about 3% per year, but is using less oil due to increased efficiency. So even though demand for goods in general has grown, the demand for oil is growing more slowly than in the past. This leads to lower real oil prices, or moderate oil prices that we see today.
If supply does not meet demand and oil stocks fall, then market oil prices will rise and supply will expand and demand will contract to balance the oil market.
Dennis,
I believe efficiency and declining global birthrates both are playing a role here within the context of oil consumption.
Iron Mike,
Yes perhaps. I assume real GDP per capita will continue to grow at about 1.5% per year as it has on average from 1975 to 2023. As the rate of population growth slows, it is expected that the annual growth rate for real GDP will also be lower.
In my mind the change in efficiency may be the more important factor, but I haven’t looked at the numbers to check. My intuition may be wrong.
I do think that some of the efficiencies (talking primarily about energy), have been added to prosperity rather than reduction of demand. Examples including semiconductor industry (chips), LED lighting and the automotive industry. Rather than a reduction of consumption, we get more chips (some of them them cheap, but some of them more expensive as well), more LED lighting at reduced cost and more automotive milage at reduced cost overall as well. So it is a substantial prosperity boost in some cases, given the same energy input.
Kolbeinth,
Exactly, that is what lower energy intensity gets us, more real GDP per unit of energy consumed.
D. Coyne
That is the core. At least from the demand side of the equation. The supply side of the equation must be catered for as well.
Kolbeinth,
I agree, typically in a market economy prices will help the adjustment. If supply is short of demand prices rise which encourages more supply and less demand. High prices for oil tend to increase the efficiency with which the oil is used. Today we would expect high oil prices to lead to a faster transition to electric transport for example.
To what degree does the substitution of FFs by renewables play a role in the appearance of increased efficiency? Every KwH generated by FFs requires more than one KwH of FF input, so switching to wind/solar increases the efficiency by cutting out the losses which are incurred by converting FFs into electicity ,but doesn’t neccesarily increase the KwH to output ratio, no? It’s probably really hard to get solid numbers on that though…
Matt:
“We have to assume that the quotas have the function to cover up production problems”
I don’t really get this.
1. First of all, “have to assume” is a very strange construction. Maybe it’s just a writing glitch, but it sounds almost religious, rather than an evidence based argument.
2. The idea that OPEC is busy bamboozling peak oilers is…uh…self-important. OPEC exists to help its members economically (by raising oil prices), not to confound amateur, conspirancy-tinged oil analysts.
3. There is an incredibly long history of OPEC constraining supply to prop up prices. As recent as the Covid-driven demand drop we saw this. But also, many, many times in the decades before. Now, of course it’s possible that OPEC is pumping all out now. And it’s possible that Lucy will let Charlie kick the football this time. But the history sure argues otherwise.
So… the onus of proof is on you. And…I did go to your article and all it was, was the usual time series. I guess, if I state your argument, it is that you haven’t seen higher production than in 2018 peak, so they must be physically constrained. I mean…that’s something. But not a strong argument. Not several independent supports. After all, perhaps OPEC could just go back to 2018 levels, at least.
Your “it already peaked” argument also ignores the long time periods previously, where OPEC production stalled (73-80, 97-01, 05-09). Each followed by a drop. Then years later, a rise. So…you really need WAY more time to see if the most recent “peak” was the final peak. Long, long history of peakers calling the peak early… Doesn’t mean their failures prevent you from new predictions. But your new calls should show some sophistication and some awareness of previous failed peak calls, not just smell like one more similar flimsy argument.
Matt, re Impact of Corona Virus similar to some earlier peak oil scenarios:
In a sense, any financial recession/depression is somewhat similar. And this is regardless the cause. A pandemic, collapse in oil production, financial crisis, asteroid hitting, alien invasion, major war, etc.
But I’m sort of amazed that you don’t recognize the difference between a supply crisis for oil (the classic peak oil idea, Twilight in the Desert, etc.) versus a demand fall-off for other reasons. The major difference is the price of oil. If the recession is independent, then we have a collapse in oil prices because demand is low. In the case of the pandemic, there was a major fall-off in demand for gasoline (automobiles) and for kerosene (jet engines). So the price of oil was low.
A classic peak oil would be the opposite in terms of oil price. Price would be very high. And the unavailability of oil (at low prices) would crash the economy. So, kind of the opposite in the chain of cause and effect. And most notably, you can look at oil price and see if the issue is a demand shock (low price) or a supply shock (high price).
I would wax on, on how you should know better, especially after years of amateur oil analysis. Then again, it’s kind of common how economically and analytically flawed the peak oil crowd is. So, in that sense, I’m not surprised.
the unavailability of oil (at low prices) would crash the economy.
That’s the classic Peak Oil idea, but it doesn’t really make sense. We saw high oil prices about 10 years ago for a decently long time (IIRC about 3 years) and there was no crash.
50 years ago an oil price shock could help spark a temporary recession in the US, in part due to trade imbalances, in part due to the Fed reaction. Since then the Fed has become much more sophisticated about excluding oil prices from their monetary policy, the US has pretty much eliminated oil & oil product imports, oil has become a smaller part of the economy, and substitutes are much more available.
Gas prices are still a political weapon, but a depletion induced PO crash seems mighty unlikely. OTOH, I wouldn’t argue for complacency.
For instance, I do worry about a Persian Gulf war. Overall oil is unreliable, expensive and polluting. We do need to transition away from oil ASAP.
Fair point about the lessening crude dependency of the economy. I do think at some point (e.g. a quadrupling in price), there would start to be a substantial drag to the economy (more than a shock recession of the monetary cycle). After all, there’s still a lot of rail, tractors, ocean ships, etc. dependent on diesel. And some massive runup in price is not impossible to imagine (e.g. closing the Strait of Hormuz). Crude tends to be rather inelastic to price (not completely of course, but “rather”), so that small shifts in supply (or demand) curves, lead to large changes in price.
I hear you on the wanting to get away from oil. I’m saying “hear”, not agree. I do think that a lot of the peak oil drive, movement, mood was driven by environmentalism. (IOW, there was a fair amount of “hoping” for peak oil, rather than fearing it. That’s why The Oil Drummers were bummed about shale, rather than happy.) See for instance how Post Carbon Institute has mostly repositioned itself to basic anti-oil environmentalism, versus peak oil stuff. Same for the Archdruid. Same for that guy who wrote “there’s enough to fry us all” (forget his name). The insight here though is that there was some “hopium, copium” affecting the analysis. It wasn’t dispassionate or disinterested.
This “wishcasting” bias is well known in political blogging, where if you ask Democrats the % chance of a win, they will overestimate it (versus say the betting markets) in their favor. And Republicans will do the exact same, but in an opposite direction. I think this comes from some tribalistic impulses that humans have. We are not complete rules based logical computers. We are smarter monkeys. Darwin taught us that. And modern psychology shows it more and more, also.
Hmm. Why don’t you agree about getting away from oil?
Nick, you should in no way question your own beliefs. But you should just realize that there are other people out there with different views. If you only hang with liberals, it can seem strange that there are conservatives. (But in reality, it is a 50:50 split, about.) Or if you like the Cowboys, realize that the rest of the country hates them.) It’s not even about peak oil, just about A and not A. And just realize there are a butt load of people with different views. They might be wrong (or you might be wrong.) But they are out there. Just don’t assume that everyone else is a liberal, environmental, Covid-fearing, Trump-hating, NPR-listening right thinker like yourself. And like your friends.
There be Neanderthals out there:
https://www.youtube.com/watch?v=rlzcEZ71Lj8
Anyhow, good chatting with you. 😉
Ok. If I understand correctly, you’re arguing that scientific questions (such as pandemic risks, or climate change) can be answered on the basis of group loyalties, and in the case of climate change yours is to the oil industry.
A pity.
—————————————–
For what it’s worth, as a rule I don’t listen to NPR, YouTube (so I’m not likely to listen to a YouTube link) MSNBC, CNN or Fox: they’re just low-quality entertainment, and have a very poor ratio of information to time invested.
Maybe 20% instinctive tribalism–don’t you find the breathy voicings on NPR effeminate? 😉
Maybe 50% agnostic. Like just reserving judgment.
And the other 30% is (and perhaps this is non-MECE versus the tribalism), an instinctive preference for off-grid, versus on-grid. There is something about diesel. You can transport it anywhere. buy it. Use it. Not connected to the NSA sticking a boroscope up your ass as you live in the modern day Matrix movie.
But…I’m not trying to argue. Just to communicate, since you asked.
Nony,
Yep. On scientific questions there is a lot of ignorance, I just didn’t put you in that group, guess I was incorrect.
There are those that believe the Earth is flat, but I don’t really pay attention to every viewpoint as there are many points of view and many of them are demonstrably false.
To those who say that we have to “get off oil” you’re not thinking about in the right way. Neither are the oil industry apologists, by the way.
The truth is, on a long enough timeline, we are all getting off oil whether we like it or not. Nature, history, etc. is completely blind to human wants. All it knows is what is available, and at what cost.
If oil is depleted, it’s depleted, period. Once you are midlife and older, you are midlife and older, period. Once your member stops getting hard, it stops getting hard, period.
The oil is going away. It’s all being produced and being burnt up, right here and right now, and will continue to be, somwhere, by somebody in the world. Eventually it will all be gone, full stop.
The transition to electric transportation is moving much faster than that. Electric is already cheaper for most applications than liquid fueled – it’s mostly a question of scaling it up, making it convenient, educating people, overcoming oil industry resistance. There’s a reason why China’s car industry is moving towards it very very fast (50% of new sales and still growing fast).
Similarly, solar is much cheaper than coal or nuclear, and even beats NG. Solar and wind are the vast majority of new generation capacity: it’s nibbling away at coal, and when coal has disappeared it will move even faster on NG.
We humans are perfectly capable of phasing out things that no longer work well: coal gas, kerosene lighting, horse-powered oil drilling, horse transportation, wood powered trains, coal fueled trains, coal fired home boilers, lead paint, leaded gasoline, mercury thermometers, mercury lighting, Freon, etc,.
Vaclav Smil points out that some energy transitions have moved slowly, or never phased out the old source, but that applies to things that people choose to keep. Compare horses and bicycles: horses have been 99% phased out, but bicycles are still considered useful in niche applications. So…some things are still useful so they still are used, othered, like leaded gasoline have been phased out.
At some point FF will be considered too expensive, risky and polluting to keep at all. Kids will be amazed that we ever used it.
Nick G, ….. “solar is much cheaper than coal or nuclear, and even beats NG”
If this was even close to true, then the new Aluminium smelters being built in Indonesia would be building Solar installations with battery back-up. But they are not, they are going to use new coal fired powered electricity.
Adaro is building both a coal fired power plant and an Aluminium smelter for around $US2B total, as phase 1 of their plans. Just the solar installation to provide the same amount of power would cost around the $US6B mark without any battery back-up. Add the batteries and it gets to over $US20B.
Without the cheap Aluminium provided by such new smelters, solar panels cannot be ‘cheap’. If all Aluminium was made by only solar, wind and batteries by law, it would become a lot more expensive and send the price of solar panels up because they use Aluminium for the frames and a lot of the time for supports.
Plus of course it takes 400kg of ‘pet coke’ to drive off the oxygen from the bauxite to make 1 tonne of Aluminium anyway.
There is nothing green nor sustainable about solar, wind or batteries. It’s a dead end for dreamers that refuse to acknowledge the damage our civilization is doing to natural ecosphere in a vain attempt to keep civilization going a few more years.
Nick G,
Once again you demonstrate your total lack of ability to comprehend and understand the challenges with replacing finite fossil fuels with unreliable renewable energy. I cannot quite figure out how you seem to think that PV and Wind can be produced from electricity alone. You cite no evidence on how silica or bauxite can be reduced at a bearable cost utilising electrical energy. The same applies to wind power. How on earth will epoxy resins be magically created from electricity. Same for reduction of iron ore.
SGP was absolutely correct in his view. We are squandering these valuable resources, be it coal, oil, or gas in the pursuit of an unsustainable lifestyle that will soon be gone for most of mankind.
Economic theory implies that is the price increases then the supply will follow. But in the case of Peak Fossil Fuels the supply will not react to pricing signals in the classic way. No amount of money is going to defeat the laws of physics. When an oil resource is depressurised, i.e bubble point is achieved then the remaining oil increases in viscosity and density as the lighter fractions are produced and the heavier fractions left behind. You are then in stripper well territory.
The is no magic bullet that will overcome the second law of thermodynamics. So your idea that mankind is good at phasing things out that do not work well is not going to apply because so fall there is nothing than can remotely challenge the utility and energy density of oil and gas.
Vaclav Smil is hardly an example in a pioneer of new technology. Go and read up about Kior. He lost his shirt on that boondoggle.
Can not, I can not figure out why you must see everthing has to be a silver bullet or failure. Humanity didn’t get to this point in history by a single bullet and it’s unreasonable to expect to solve it’s problems by one action. Sure there will be a day of reckoning for civilization. But giving up and quitting to address problems is the fastest road to failure. There are thousand of means to address efficiencies and waste of humans. It’s just a waste of energy and life to go negative.
There was only one guarantee to life the day you were born and that was you were going to die. Yet here you are. Life is about the journey, NOT the destination. Quitters are needless losers.
https://www.youtube.com/watch?v=s9wYN7i5Aiw
Does the USA need Saudi Arabia anymore?
Zeihan, thinks no ( I disagree with him as he thinks USA Shale is endless, but otherwise he is a very talented geopolitical guy ).
The geopolitical implications would be crazy!!!
Zeihan is an interesting perspective but he doesn’t understand that the US is not energy independent even with Canadian tar. Most shale is being exported because we can’t refine it for the products we need. The refinery margins are too low now to allow capital investment to allow them to refine the too light tight oil.
JT, it’s not just energy that the US is not independent. Without trade the US would see a fall in standard of living. I don’t think any of us are comprehending. Today trade helps us balance out our energy needs. But, imported low cost labor in products is our real achilles heel. We are a spoiled superpower civilization. We don’t even produce enough baby milk to meet our needs. Enjoy it while it exists. There are external and ignorant self serving internal forces. Who want to take the US down in status.
New posts are up
https://peakoilbarrel.com/opec-update-september-2024/
and
https://peakoilbarrel.com/open-thread-non-petroleum-september-19-2024/