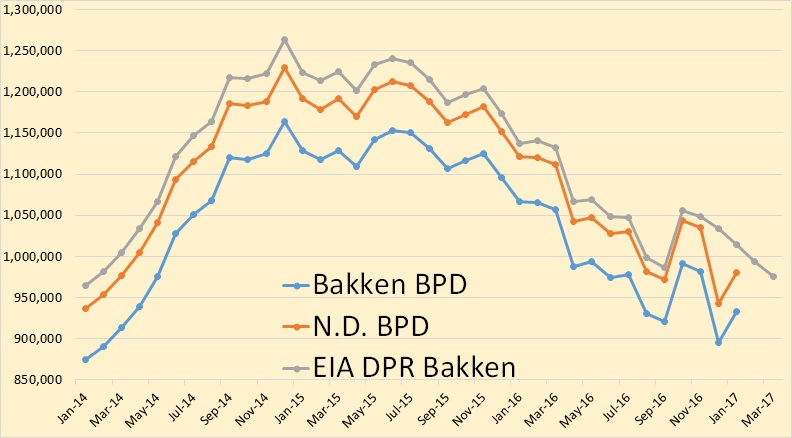
Bakken oil production was down 10,119 barrels per day in September and all North Dakota production was down 10,353 bpd in September.
Bakken production continues to decline though I expect it to level off soon.
Bakken oil production was down 10,119 barrels per day in September and all North Dakota production was down 10,353 bpd in September.
Bakken production continues to decline though I expect it to level off soon.
The era of the mighty U.S. major oil industry is coming to an end as the country’s largest petroleum company is in big trouble. While ExxonMobil has been the most profitable U.S. oil company in the past, it suffered its worst year on record.
For example, just four years ago, ExxonMobil enjoyed a $45 billion net income profit in 2012. Now compare that to a total $5 billion net income gain for the first three-quarters of 2016. If Exxon continues to report disappointing results for the remainder of the year, its net income will have declined a stunning 85% since 2012.
Actually, the situation at Exxon is much worse if we dig a little deeper.
To understand the real profitability of a company we have to look at its cash flow, or what is known as free cash flow. Free cash flow is calculated by deducting capital expenditures (CAPEX) from the company’s cash from operations. ExxonMobil’s free cash flow declined from $24.4 billion in 2011 to $1 billion for the first nine months of 2016:
So, here we can see that Exxon’s free cash flow of $1 billion (2016 YTD) is down 95% from $24.4 billion in 2011. The reason for the rapidly falling free cash flow is due to skyrocketing capital expenditures and falling oil prices. But, this is only part of the picture.
Non- petroleum comments should be posted in this thread.
Thanks.
Enno Peters recently reported on Eagle Ford output at shaleprofile.com, so I have updated my estimate of Eagle Ford output by utilizing his data. Enno reports horizontal well output from the Eagle Ford region so some output from other formations is included (Austin chalk, etc). To compensate for this I compare the data from shaleprofile to the output reported from the EIA for the Eagle Ford.
For Sept 2014 through Nov 2015 Enno’s data is about 52 kb/d higher on average each month than the EIA estimate, so I deduct this amount from my preliminary estimate to arrive at my final estimate. Enno’s data for each month from Sept 2014 to July 2016 is divided by Texas (TX) statewide C+C output from the RRC to find the percentage of Eagle Ford region to TX statewide output. This percentage is multiplied by Dean Fantazzini’s 6 month corrected estimate of Texas C+C output and then 52 kb/d is subtracted to arrive at my final Eagle Ford estimate.
The Chart below has my estimate labelled as Dennis and Enno’s Eagle Ford region estimate (horizontal wells only) labelled as Enno Peters. The EIA estimate is shown as well.