A Guest Post by George Kaplan
2017 trends for UK offshore production were disrupted by the stoppage in the Forties pipeline in December, which took several hundred thousand barrels of oil equivalent per day off line. Overall average oil production for the year dropped 61 kbpd (6.4%) and natural gas (including NGPLs) barely changed with an 800 boed drop. With the Forties issue exit rates don’t mean anything, but the running average oil production was on an upward trend in the second half of the year, which will continue through 2018, barring further major outages, while natural gas was noticeably declining and might struggle to maintain 2017s rate this year.
2016 reserve numbers fell for both oil and gas with few discoveries and some negative adjustments. Oil and gas production will decline from 2018, with accelerated falls from sometime in the mid-2020s without major new discoveries (which may include onshore shale gas, but that is not covered here).
UK C&C
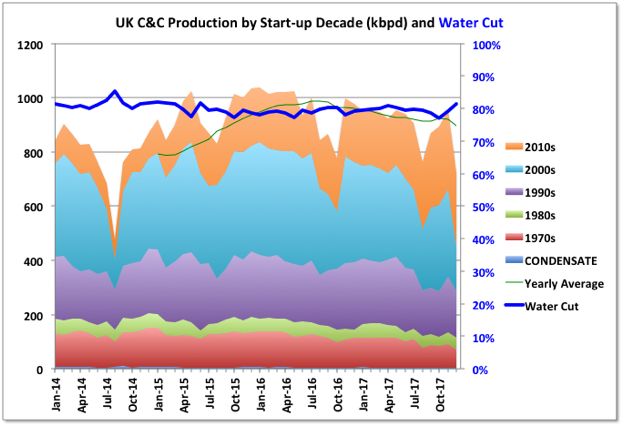
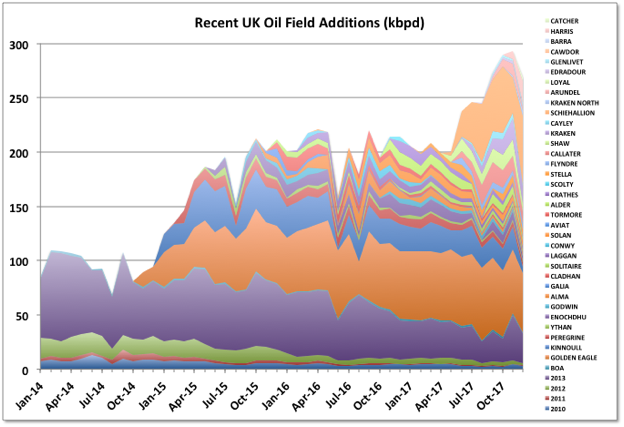
Through 2015 and 2016 a lot of smaller, short cycle developments came on line as a result of the boom from the high price years from 2011. Now larger projects started in those years are ramping up. The largest is the Glen Lyon FPSO, which is part of a revamp of two mature fields: Scheihallion and Loyal. Additionally at the end of 2017 Kraken, Catcher (including Burgman and Varadero fields) and WIDP (for fields Harris and Barra) were started and will continue to ramp up through early 2018. Clair Ridge was commissioned in late 2017, it has dry trees and a single platform drilling rig; production will ramp up as the wells are completed (they may need to complete production/injection pairs before being able to produce from each block, which may slow things down a bit). Statoil’s heavy oil field, Mariner with nameplate 55 kbpd, will also start up in 2018, after some delays. The Captain field has started trials of polymer injection, which is intended to ramp up through 2021, and, if successful, will maintain current production rates at around 25 to 30 kbpd.
The availability from some of the larger, mature producers seems to be increasingly impacted by unplanned outages, possibly just due to chance or their age, but maybe also impacted by cost cutting in response to the price drop in 2015. Apart from the Forties pipeline issue, in January the Chevron-operated Erskine field was taken offline by a wax pipeline blockage while pigging, there have been a couple of instances of fields being partially evacuated because of water quality issues, and the Ninian platform was evacuated ahead of a major storm because of doubts over its structural integrity.
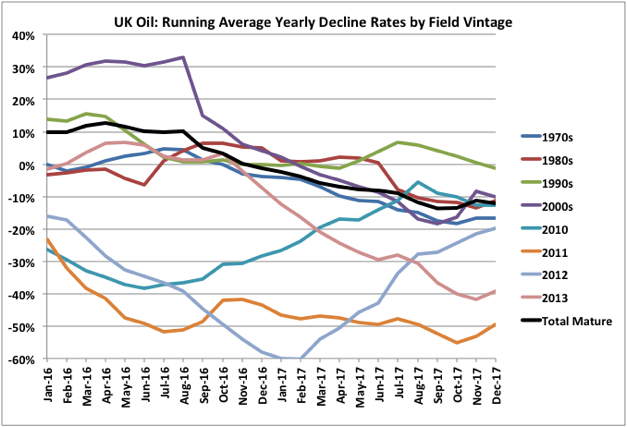
Mature Field Decline
Read More
