Comments not related to oil and/or natural gas production in this thread. Thanks.
Category: Uncategorized
OPEC December Production Data
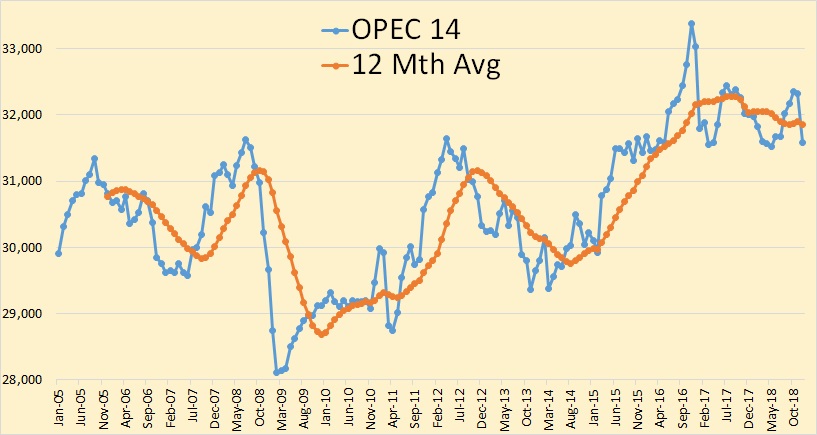
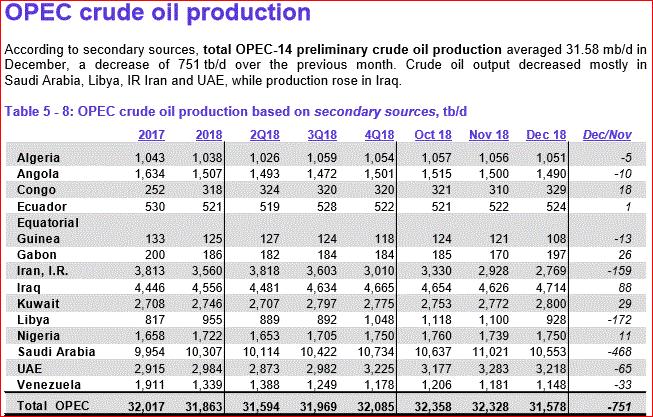
All OPEC data below is from the January OPEC Monthly Oil Market Report. All OPEC data is through December 2018 and is thousand barrels per day.
Qatar has left OPEC and is not included in this months report. All Qatar historical data has been removed from all OPEC charts.

OPEC 14 production was down by 751,000 barrels per day in December. That was after November production had been revised downward by 23,000 barrels per day.

Here you can see who had the big declines in December.
Open Thread Non-Petroleum, January 17, 2019
Comments not related to oil and natural gas in this thread.
Thanks.
Open Thread Petroleum, January 10, 2019
Comments related to oil and natural gas production in this thread.
Thanks.
Open Thread Non-Petroleum, January 10, 2019
Comments not related to oil and natural gas in this thread.
Thanks.