The EIA has finally updated their International Energy Statistics. They were a month behind so they caught up by updating two months of data. The last update had data through October. This update has the data through December 2013. They also updated their annual data page.
If you click on the link, then mouse over “Petroleum, Production” and click, you will get “Total Oil Supply”. That data is everything including ethanol, biodiesel, NGLs and even refinery process gain. I never use that data. After that page comes I go to the box labeled “Total Oil Supply” then click on the down arrow, then click on “Crude Oil including Lease Condensate” That is the data I use, that is all I use.
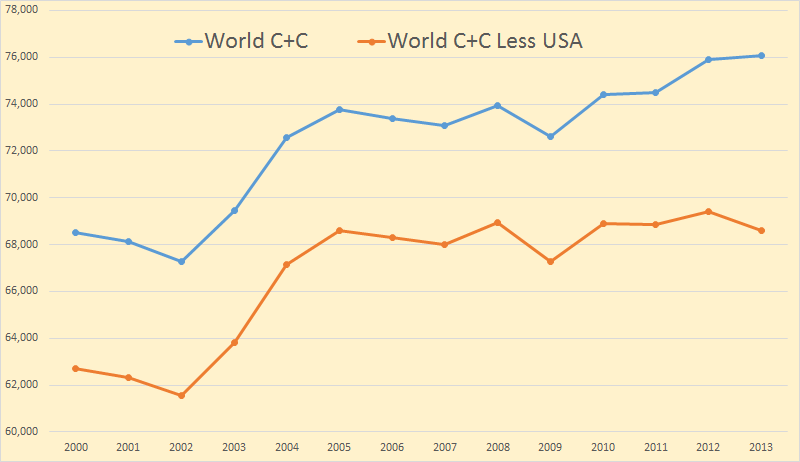
From the annual data I found total World C+C was up a mere 167 kb/d. US production was up 967 kb/d. That means that the World less USA was down 800 kb/d.
I have been following Russia pretty close on their website CDU TEK.
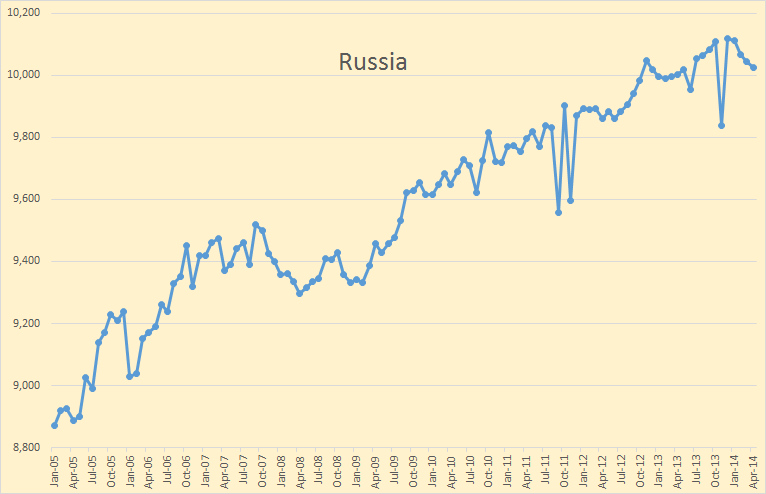
The data through December is from the EIA. The last four months, through April, I gleaned from the Russian website. Their data is daily in tons per day. I had to convert it and average it into monthly data but it is pretty close. Also, because the data on the above chart is non-zero based the increase appears greater than it really is. The increase averages out to be about one hundred thousand barrels per year.
I don’t know what the anomaly was in November. The JODI data does not show that but actually shows a peak in November 2013 above December.
Everyone has been expecting Russia to peak for several years. But their production has just kept inching up a little each year. This report is from five years ago: Alex Burgansky: Russian Oil and Gas Industry Surprises Analysts. Requires registration.
There are plenty of projects in Russia, both, new projects and existing brownfield projects. Russia is a very mature producer. If you exclude all the drilling activity taking place every year, then Russian organic decline in production is close to 19%. To compensate for that organic decline, Russia drills somewhere between 5,000 and 6,000 wells every year.
This year, as I said before, some people expected production to collapse. We certainly never thought it would collapse, but we did think it would decline. Instead it’s actually growing as a result of benefits from past investments in the new fields coming on stream this year. But we’re simply running out of the pipeline of these new fields. Therefore, next year there will be a lot fewer fields coming on stream; in the absence of new incentives to put more money to work to grow Russian oil production, it will naturally start declining, with organic decline rates of around 19% and growing.
Read More
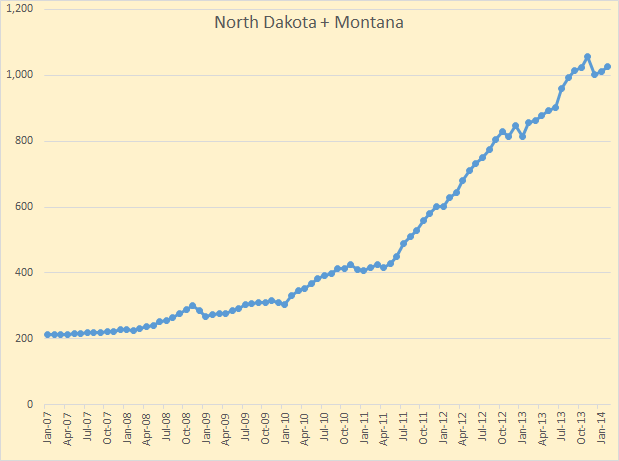 Their combined production was 1,027 kb/d. This is still below their production of 1,055 kb/d in November. This is more than just the Bakken as both Montana and North Dakota have production outside the Bakken.
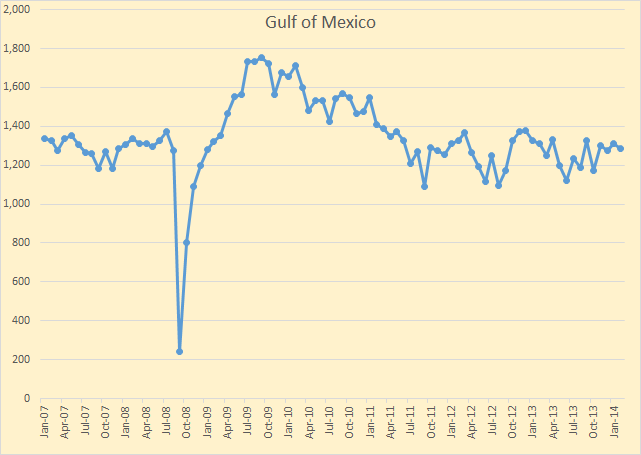 Part of the EIA’s plan for 9.6 mb/d of C+C by 2016 has The Gulf of Mexico going to 2 million bp/d by 2016. The GOM does not appear go be going anywhere however. There are new fields coming on line but they are just barely keeping up with those very high decline rates of the deep water fields. The Gulf of Mexico has her very own Red Queen.