JODI, Iraqi Reserves and Ghawar

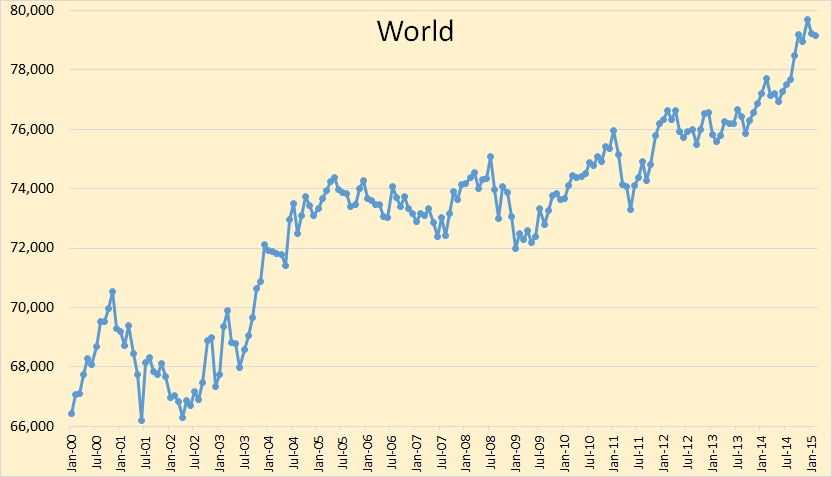
The JODI data just came in with production numbers for January 2015. I really don’t like JODI all that much but they are about two and one half months ahead of the EIA with their world data. And their data is incomplete so I have to substitute the EIA data for the countries that do not report to JODI. So the data I use is about 95% JODI and about 5% EIA. The last data point is January 2015 and is in thousand barrels per day.

JODI World

We peaked in December at 75,342,000 bpd but dropped 356,000 bpd in January to 74,986 bpd.

JODI USA

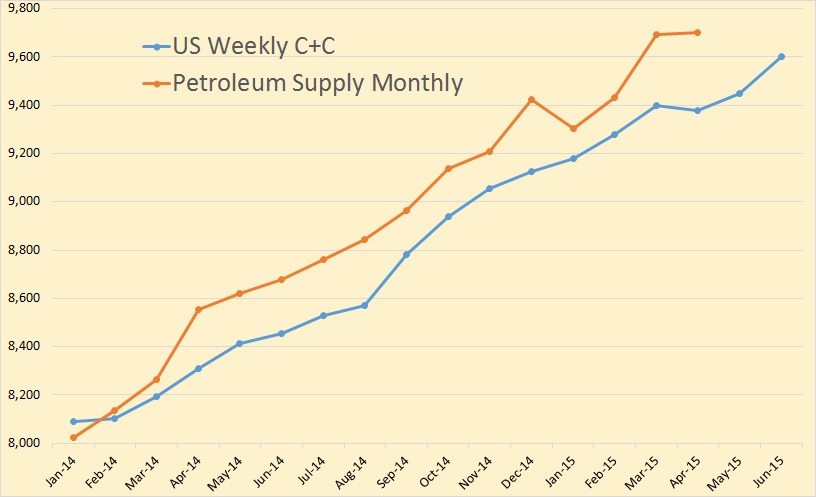
JODI has the US at 9,226,000 in December but dropping 34,000 bpd in January to 9,192,000 bpd. The US did not start its grand ascent until the summer of  2011 when the shale oil boom exploded.

Read More

Texas RRC Report and Other Peak Oil News

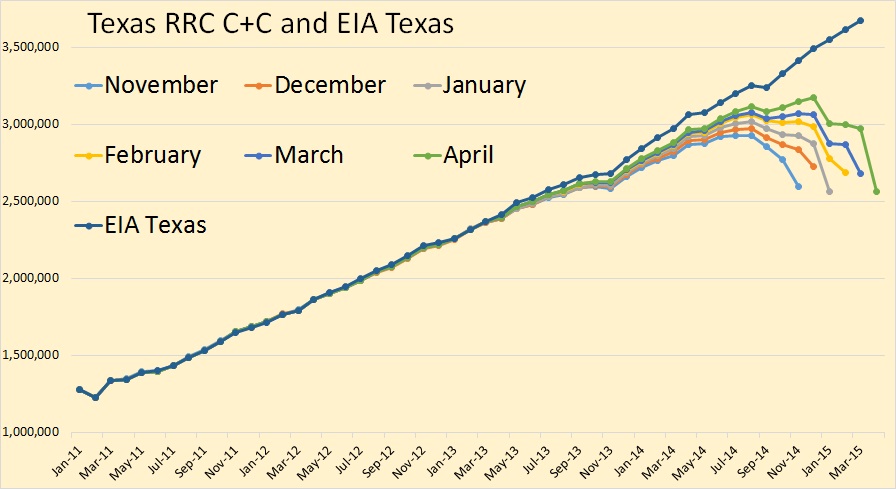
The Texas Rail Road Commission has released its latest stats with production numbers through January. There is always a delay in these numbers and that is why you see the production graph lines seem to droop toward the recent months. Because of this I post six months data so the data can be compared in order to gain a better insight into which way production is heading.

All Texas oil and gas data is through January. The Oil data is in barrels per day and the gas data is in MCF.

Texas Condensate

Texas condensate will likely show a small gain when the data is finally in. Either way it will not be enough to make much difference in the final C+C January production.

Texas Crude Only

I believe Texas crude only will be down in January. This shows a huge decline from the December incomplete data. The EIA data is through December only.

Read More

Bakken Data plus The EIA versus The EIA

The NDIC has just published the latest oil production data from the Bakken.
Monthly Oil Production Bakken Only
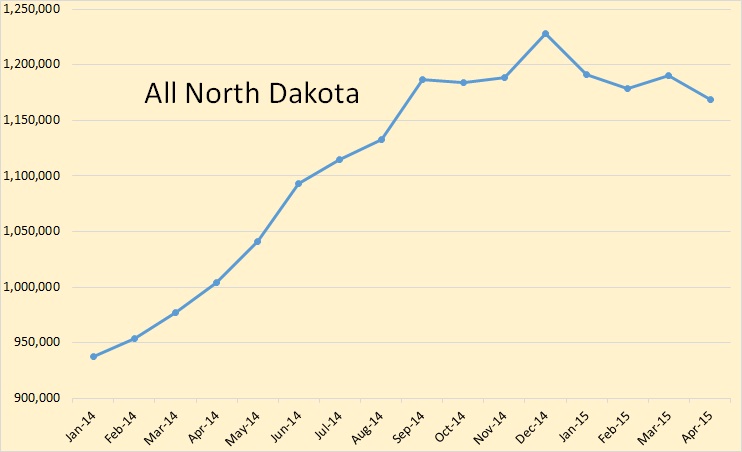
Monthly Oil Production All North Dakota

Bakken & ND Prod

Bakken production dropped by 34,619 barrels per day while all North Dakota oil production fell by 36,927 barrels per day.

Bakken & ND BPD per Well

Bakken barrels per day per well fell by 5 to 125 while all North Dakota barrels per day per well fell by 3 to 101.

Bakken Wells Producing increased by 107 to 9,052 while all North Dakota Wells Producing increased by only 49 to 11,796.

Read More

The Oil Shock Model with Dispersive Discovery- Simplified


This is a guest post by Dennis Coyne

Originally posted at peak oil climate and sustainability

Some changes have been made to this post see after the Excel File link.  Below figure 10.

The Oil Shock Model was first developed by Webhubbletelescope and is explained in detail in The Oil Conundrum. (Note that this free book takes a while to download as it is over 700 pages long.) The Oil Shock Model with Dispersive Discovery is covered in the first half of the book. I have made a few simplifications to the original model in an attempt to make it easier to understand.

shockmodfig/

Figure 1

In a previous post I explained convolution and its use in modelling oil output in the Bakken/Three Forks and Eagle Ford LTO (light tight oil) fields. Briefly, an average hyperbolic well profile (monthly oil output) is combined with the number of new wells completed each month by means of convolution to find a model of LTO output.

Read More