The World in 2030- Non-Fossil Fuel Open Thread

This is a non-fossil fuel Open Thread, with a suggested topic of what the World will look like in 2030.

There are many different visions of the future. Some see either slow or fast collapse due to financial crises caused by high debt levels, overpopulation, resource constraints, war, and environmental damage (not a complete list.)

Others see the potential for technological progress in EVs and other transportation, low cost solar and wind energy sources, reduced cost battery storage, low cost sensors, and new business models leading to disruptive changes that may allow us to overcome many resource constraints, reduce environmental damage, and transform society.  In addition, this optimistic view foresees a Worldwide demographic transition with World population peaking in 2050 at 8.2 billion and falling back to 7 billion by 2100 and reaching 2 billion by 2200 as total fertility ratios (TFR) fall to 1.6 births per woman and average life expectancy tops out at 90 years.

Reality may fall somewhere between these sharply contrasting visions of the future, but from my perspective, the future is far from clear.

Peak Oil Is Back

Where did all the oil go? The peak is back

An extensive new scientific analysis published in Wiley Interdisciplinary Reviews: Energy & Environment says that proved conventional oil reserves as detailed in industry sources are likely “overstated” by half.

According to standard sources like the Oil & Gas Journal, BP’s Annual Statistical Review of World Energy, and the US Energy Information Administration, the world contains 1.7 trillion barrels of proved conventional reserves.

However, according to the new study by Professor Michael Jefferson of the ESCP Europe Business School, a former chief economist at oil major Royal Dutch/Shell Group, this official figure which has helped justify massive investments in new exploration and development, is almost double the real size of world reserves.

Wiley Interdisciplinary Reviews (WIRES) is a series of high-quality peer-reviewed publications which runs authoritative reviews of the literature across relevant academic disciplines.

According to Professor Michael Jefferson, who spent nearly 20 years at Shell in various senior roles from head of planning in Europe to director of oil supply and trading, “the five major Middle East oil exporters altered the basis of their definition of ‘proved’ conventional oil reserves from a 90 percent probability down to a 50 percent probability from 1984. The result has been an apparent (but not real) increase in their ‘proved’ conventional oil reserves of some 435 billion barrels.”

Global reserves have been further inflated, he wrote in his study, by adding reserve figures from Venezuelan heavy oil and Canadian tar sands – despite the fact that they are “more difficult and costly to extract” and generally of “poorer quality” than conventional oil. This has brought up global reserve estimates by a further 440 billion barrels.

Jefferson’s conclusion is stark:Put bluntly, the standard claim that the world has proved conventional oil reserves of nearly 1.7 trillion barrels is overstated by about 875 billion barrels. Thus, despite the fall in crude oil prices from a new peak in June, 2014, after that of July, 2008, the ‘peak oil’ issue remains with us.”

Read More

OPEC Update

All charts are updated through March 2016

The latest OPEC Monthly Oil Market Report is out out. The charts are “Crude Only” production and do not reflect condensate production.

Also the charts, except for Libya, are not zero based. I chose to amplify the change rather than the total. OPEC is now 13 nations with the the addition of Indonesia.

All Data is in thousand barrels per day.

OPEC 13

OPEC production was up 15,000 barrels per day in March. But there has really been very little change since June of 2015.

Read More

World Crude plus Condensate Decline Rate

There is concern that World C+C may decline steeply after the peak, I believe those concerns are over blown. There is always the possibility that there could be a severe recession due to high debt levels, high oil prices or potentially due to both problems in combination. War and environmental damage due to overpopulation are also potential problems which may lead to a crisis.

If none of these problems arises in the near term (say for the next ten years), and demand for oil is high enough to keep annual average oil prices above $75/b from 2018 to 2025, then the average annual decline rate of oil (C+C) output will remain under 2%.

For simplicity in the analysis that follows, I assume the peak in C+C output is 2015 and that output will decline at a relatively steady rate from 2015 to 2025. This in unlikely to be the case in practice and the actual path of future world output is unknown, the intention is to determine a likely trend line for World C+C output.  Using quarterly C+C output data from the EIA, I constructed the charts that follow.

Data is from the International Energy Statistics page at the EIA website.

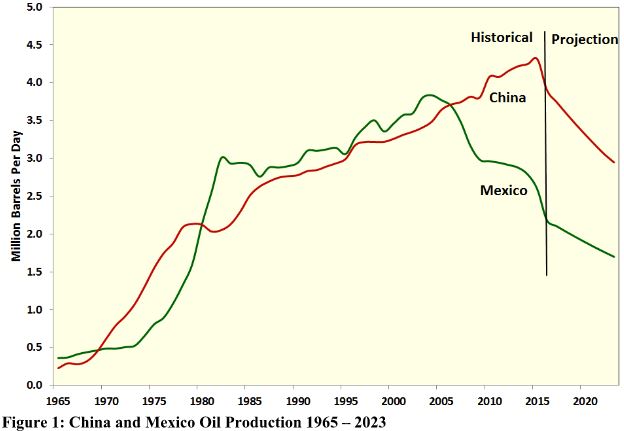
The “Big 14” oil producers from 2002 to 2015 are (in order from largest to smallest): Russia, Saudi Arabia, United States, China, Iran, Mexico, Canada, UAE, Venezuela, Kuwait, Iraq, Nigeria, Norway, and Brazil. The Rest of the World (ROW) is all other oil producers besides the “Big 14”.
All charts below (except the natural log charts) are in kb/d.

declinepost/

Read More