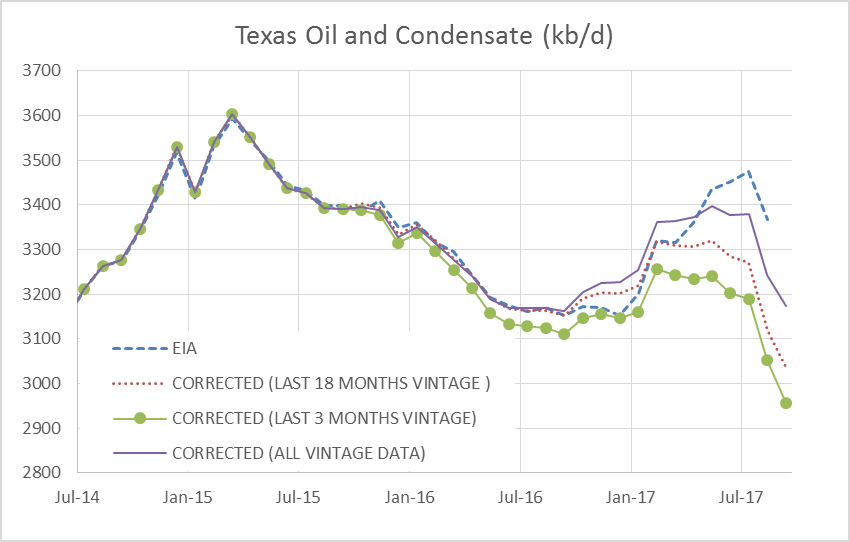
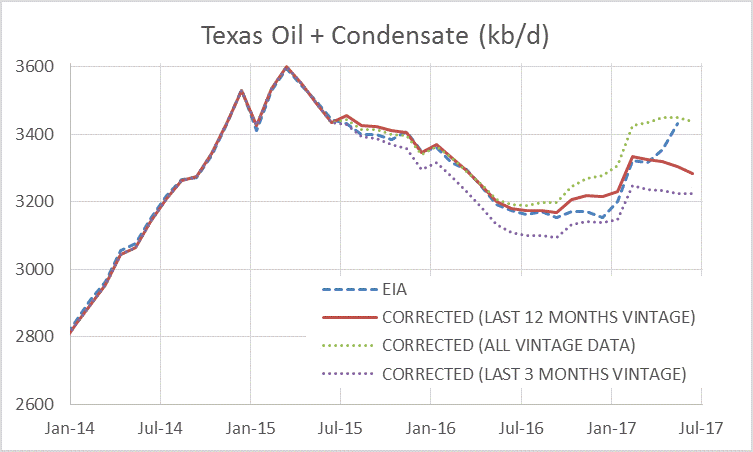
Dean Fantazzini recently updated his estimates for Texas Oil and Natural gas. Data from the Texas Railroad Commission has improved so correction factors are smaller, the estimates from Dean now match the estimates by the US EIA fairly closely for Crude plus condensate (C+C) produced in Texas.
There was a noticeable change in the Texas data about 6 months ago so I show an estimate based on the correction factors from the previous 6 months. Dean prefers to show an estimate based on all the data (which he has done for many months) and an estimate based on the most recent 3 months of data (which has been presented more recently). The EIA estimate is more consistent with the 3 month or 6 month estimate with the “all vintage data” estimate being somewhat higher.
Category: Texas
Texas Update- January 2017
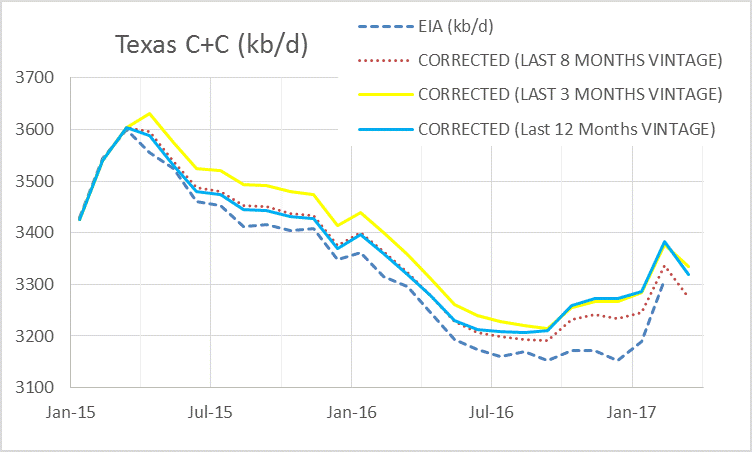
October C+C in Texas was 3151 kb/d and in November it was 3161 kb/d, using the 3 month vintage estimate.
The data from Dean Fantazzini can be found at link below, please credit him if this data is used.
https://www.dropbox.com/s/6mp6sqktz9h33jo/vintage%20November%202016.xlsx?dl=0
Texas Update -December 2016
The labels in the chart above are for the “corrected (3 month)” estimate. This estimate (now preferred by Dean Fantazzini) is 35 kb/d lower than the EIA estimate for Sept 2016 (which is the most recent EIA estimate). Texas C+C output has fallen by about 500 kb/d from the April 2015 peak. Read More
Texas Update- November 2016
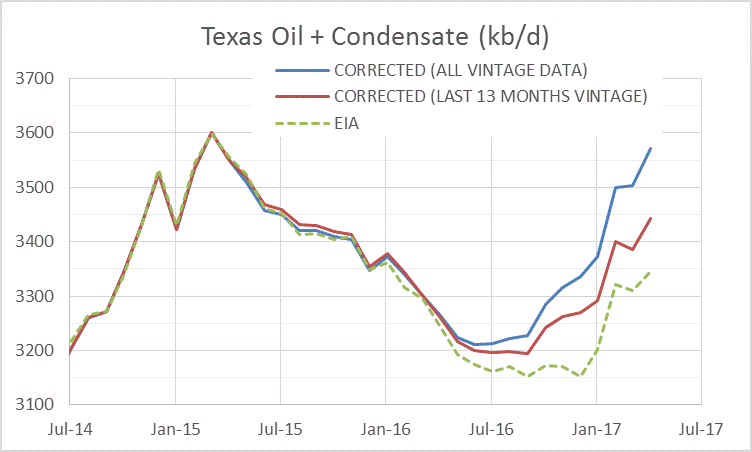
Edit 12/2/2016, 8:30 AM EST. A corrected chart for correction factors below and a new chart added.
The railroad commission of Texas released September output data a few weeks ago and Dean Fantazzini made an estimate of the “corrected” data for crude plus condensate (C+C) and natural gas. Last month he found there had been a structural change in the data in March and provided a new estimate using only the most recent 3 months of data, I chose to use the most recent 6 months of data instead.
This month I will present the old estimate (labelled “all”) using all vintage data (dating back to April 2014) as well as the 6 month and 3 month estimate, which use the most recent 6 months and 3 months of data respectively. Read More
Texas Petroleum Output – October 2016
The Railroad Commission of Texas (RRC) has recently reported new data for oil and natural gas output through August 2016. Dean Fantazzini has kindly shared his corrected data using the most recent data from the RRC. He uses a statistical procedure which adds up the changes in the RRC data from April 2014 to July 2016 to see how incomplete the data has been in the past and uses this to estimate the “missing barrels of oil and cubic feet of natural gas” that will be added to the current “incomplete data” over the following 24 months. In the past the RRC data has been about 99% complete when you look back 24 months from the most recently reported month. Dean estimates the “correction factors” which need to be added to the reported data to get a more reliable estimate of recent output levels.
The correction factors for the month of August looked very low compared to the historical correction factors so I asked Dean to check for a statistical break in the correction factors. Essentially in the past there has been no statistical trend in the correction factors based on Dean’s analysis, but I wondered if perhaps there was now a downward trend in the correction factors due to the digitization of reporting by the RRC.
I will quote Dean’s findings below (from an e-mail):
I checked the time series for each correcting factor -for crude oil only- using unit root tests with a breakpoint, and I found that the correcting factors for the latest 6 months are non-stationary (even at the 1% level), with a break in the constant which took place in February 2016. The previous months (older than 6 months) are instead stationary.
The effect of the ongoing digitalization process seems to (finally) appear in the data. However, many more data will be needed to confirm the break in the data structure: for example, the break in the constant is significant only at the 5% probability level, but not at the 1% level.
Given this evidence, reporting both the corrected data using all the vintage data and the corrected data using the last 3 months (to take the structural break into account) may be a wise thing.
I decided to show the correction based on the last 6 months rather than 3 months because that is where the break occurs, though the difference between 3 months and 6 months is not significant (a difference of 12 kb/d less on average each month.) I also show the previous method of using all the data (Jan 2014 to Aug 2016 for oil and April 2014 to Aug 2016 condensate), this is called all vintage in the chart that follows.