Below are a number of oil (C + C ) production charts for Non-OPEC countries created from data provided by the EIA’s International Energy Statistics and updated to October 2019. Information from other sources such as the IEA and OPEC is used to provide a short term outlook for future output and direction.
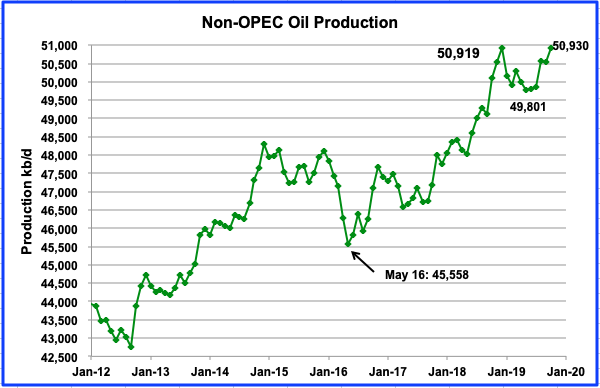
Non-OPEC production increased by 382 kb/d to 50,930 kb/d in October from 50,512 kb/d in September. This is second highest monthly increase for 2019 after the August increase of 699 kb/d.
October’s production exceeded the previous high of 50,919 kb/d reached in December 2018 by 11 kb/d. Gains from Norway, U.S, and Canada overcame declines from other countries to post the new October record.
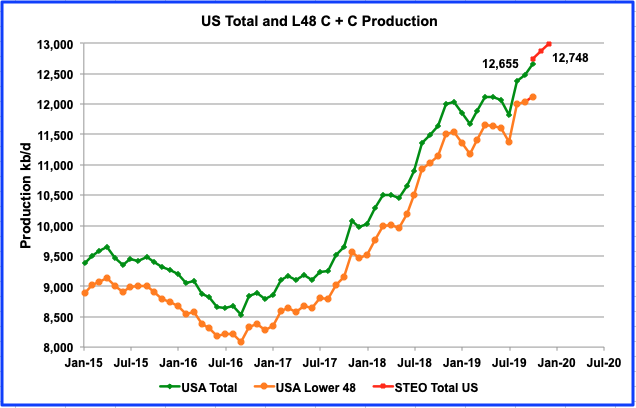
Contrast what has happened with output in 2019 with 2018. From December 2017 to December 2018, production increased from 47,768 kb/d to 50,919 kb/d, an increase of 3,151 kb/d. Of this, the three largest contributors were U.S., Russia, and Canada. From December 2018 to October 2019, production so far has increased by 11 kb/d. How much will the next two months add?
Read More