World Energy 2018-2050: World Energy Annual Report (Part 1)

Guest Post by

Dr. Minqi Li, Professor
Department of Economics, University of Utah
E-mail: minqi.li@economics.utah.edu
June 2018

This is Part 1 of the World Energy Annual Report in 2018. This author has developed world energy annual reports that have been posted at Peak Oil Barrel since 2014. The purpose of this Annual Report is to provide updated analysis of the current development of world energy production and consumption, consider possible scenarios of world energy supply over the 21st century, and evaluate their implications for global economic growth and climate change. This year’s Annual Report includes multiple parts:

Part 1 World Energy 2018-2050
Part 2 World Oil 2018-2050
Part 3 World Natural Gas 2018-2050
Part 4 World Coal 2018-2050
Part 5 Global Carbon Dioxide Emissions and Climate Change 2018-2100

Part 1 summarizes the general findings of this year’s World Energy Annual Report. Given the currently available information, world oil production is projected to peak in the early 2020s, world natural gas production is projected to peak in the 2030s, and world coal production is projected to peak in the late 2020s. Wind and solar power is projected to grow rapidly and account for about one-third of the world energy supply by the mid-21st century. Despite the rapid expansion of renewable energies, global energy supply and economic growth are expected to decelerate over the coming decades. By the mid-21st century, the energy-constrained global economic growth rates may not be sufficient to ensure economic and political stability for the existing world system. Although world carbon dioxide emissions are projected to peak before 2030, cumulative carbon dioxide emissions over the 21st century will be sufficient to result in global warming by more than two degrees Celsius relative to the pre-industrial time (assuming there will be no large-scale carbon sequestration programs).
Read More

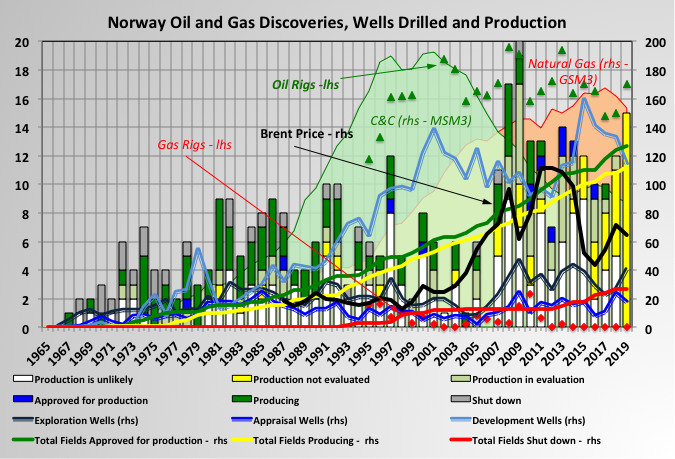
Norway Production, 2017 Summary and Projections

A Guest Post by George Kaplan

Average annual Norwegian wellhead C&C production dropped 1.5% in 2017, from 1709 kbpd (625 mmbbls total) to 1682 kbpd (614 mmbbls total). Wellhead gas (which includes fuel gas, flaring and gas injection) rose 2.6% from 2805 kboed to 2878 kboed. Exit rates were down 9% for oil andt 4% for gas, some of which was due to the Forties pipeline failure in December, but the decline appears to have continued in the first quarter of 2018.

Three small projects, Flyndre, Sindre and Birding, and two larger ones Gina Krog and Maria, came online. Sindre appears already to be exhausted. Flyndre is shared with UK and is declining fast. Gina Krog, discovered in 1974, is a tie back via a wellhead platform to Sleipner with nominal nameplate capacity of 60 kboed (split about evenly between oil and gas), and Maria is an oil tie-back to the Kristin semi-sub, but with water injection supplied from Heidrun, with 40 kbpd nameplate and is still ramping up after first production in December.

Norway C&C

The data shown in the charts is through February, but the NPD figures for this year have not been as complete or unequivocal as usual, so should be considered accordingly. A number of fields have no reported wellhead figures for January or February, though they do have sales reported (to fill the gaps I have prorated from these numbers based on previous complete monthly data). Additionally it looks for some reason that the sales figures for 2017 have all been doubled and the numbers for NGL are being switched from reporting in Te/d to m3/d, so there’s a bit of uncertainty.

chart/

Troll

Troll, started in 1990, is by far the largest gas producer but also, currently, the largest oil producer, at around 150 kbpd, which has been kept steady for several years. The oil comes from a thin oil rim, produced from long, horizontal wells that are being continually drilled. The oil has to be produced before the gas cap can be blown down. R/P for the oil is about two and a half years, and the contract for Troll Phase 3, the gas reserves over the oil rim, was awarded this January with production expected in the second half of 2021. This would suggest the oil production will be kept high, and then start to drop quickly through 2020. Troll gas current reserves are almost half depleted and with an R/P of over twenty years, but the approved production rate has recently been increased to make up for declines in other fields, and this may continue.

The original development plan by Shell for Troll was to ignore the oil as they did not think it could be developed economically, mainly because it would have required hundreds of vertical wells; this was rejected by the Norwegian Petroleum Directorate. Short horizontal wells had previously been drilled in USSR (actually in the 1930s), Australia and Alaska but in the late 1980s extensive, and expensive, development for long reach, accurately placed horizontals, drilled from offshore floating rigs, was conducted by Norsk Hydro with NPD input. In the early 90s I remember Norwegian news outlets complaining that they perceived this as a waste of tax-payers money, but the effort has certainly paid off since. A similar large oil rim resource, Frigg, was not produced in an earlier gas development and was lost; by contrast Troll Oil will produce almost two billion barrels.

Statfjord

Statfjord, started in 1979, is still a large producer, at about 25 kbpd, many years after its original decommissioning date, although there are signs now of decline, which is likely to be terminal. It straddles the UK-Norway border and about 15% is owned by the UK through the local Statoil subsidiary. Interestingly at one time, by maritime law, the UK could have claimed all of the Norwegian Trench, which includes Statfjord and several other of the largest Norwegian fields, but instead agreed to a border based on the meridian line between the two countries. I think the UK oil and gas authority had been reporting UK Statfjord production as total rather than the UK share, maybe by wishful thinking, which has skewed some numbers and has only been corrected in the last few months.

chart/

The irregularity in Goliat production shows up in the curves for recent additions, but there is a clear trend for quite early and rapid decline, even among the larger developments.
Read More